01 / 12
Real-Time Intelligence
Built for daily decisions — not static monthly PowerPoint reporting.
Daily
Update Frequency
Custom extraction pipelines refresh data multiple times per day. No manual exports. No stale numbers.
50+
Views & Visualizations
Every visualization type in one platform at your fingertips instantly — KPI dashboards, pivot tables, graphs, pacing, heatmaps, and more.
<1s
Query Response
Server-side actions with intelligent caching deliver near-instant results across all 50+ views without sacrificing data freshness.

What is Helix
Helix isn't a dashboard.
It's the system behind
better decisions.
A unified intelligence architecture that weaves together every layer of your data — from channels to campaigns to backend data — into a single cohesive view built for clear and quick analysis.
Built by media buyers for media buyers.
We don't replace your tools. We connect, harmonize, govern, and supercharge them.
01 / BUILT DIFFERENT
Designed by media buyers
Every view reflects how campaigns actually operate in the real world — not how data analysts think they do. That's why Helix is used daily, not just looked at.
02 / FULLY BESPOKE
Never templated
No cookie-cutter frameworks. Helix is custom-architected per client, based on their own unique datasets, naming taxonomy, and key metrics that matter for the business.
03 / TRUST FIRST
Accuracy & governance built in
Automated governance across data accuracy, dimensional accuracy, and naming taxonomy validation. Pretty visuals don't matter if the numbers are wrong.
Proven Outcomes
We've done this before, for brands at scale.

Reporting Transformation
4 Days
From raw data to 30+ visual dashboards across 10 channels
5+ Hours Saved
per Week
per Week
15+ manual exports replaced by a single dashboard, no more ugly pivot tables

Run on Clouds
Campaign Command Center
24 Hours
25+ visuals across 10+ sources in 3 markets completed in under 24 hours
Custom Pacing Tracker Deployed
50+ initiatives and 700 campaigns in one pacing view across all markets and channels

Executive Level Views
2 Hours
From raw cross-channel business level data to complete dashboard
Zero Manual Reporting
Weekly decks eliminated. Dashboards replaced 3 days of manual reporting
Live API Connections
Connected directly to every platform you buy.
Connections straight into the ad platform APIs allowing for instant robust reporting views, without needing a developer to write code.
01
Real-time breakdowns
Age, gender, device, geo and more — pulled live from each platform's API, not from a nightly export.
02
Pre-built modules per platform
Frequency analysis, creative fatigue, audience analysis, attribution insights — purpose-built for each platform's data.
03
No more platform hopping
Instant access to reports you'd otherwise build by hand in each ad platform, one at a time.
04
Intraday Spend Pacing
Smart pacing to show you how much you have spent to the exact minute, while also comparing against your recent trends to project future spend for the rest of the day. Great for promo and holiday time periods.
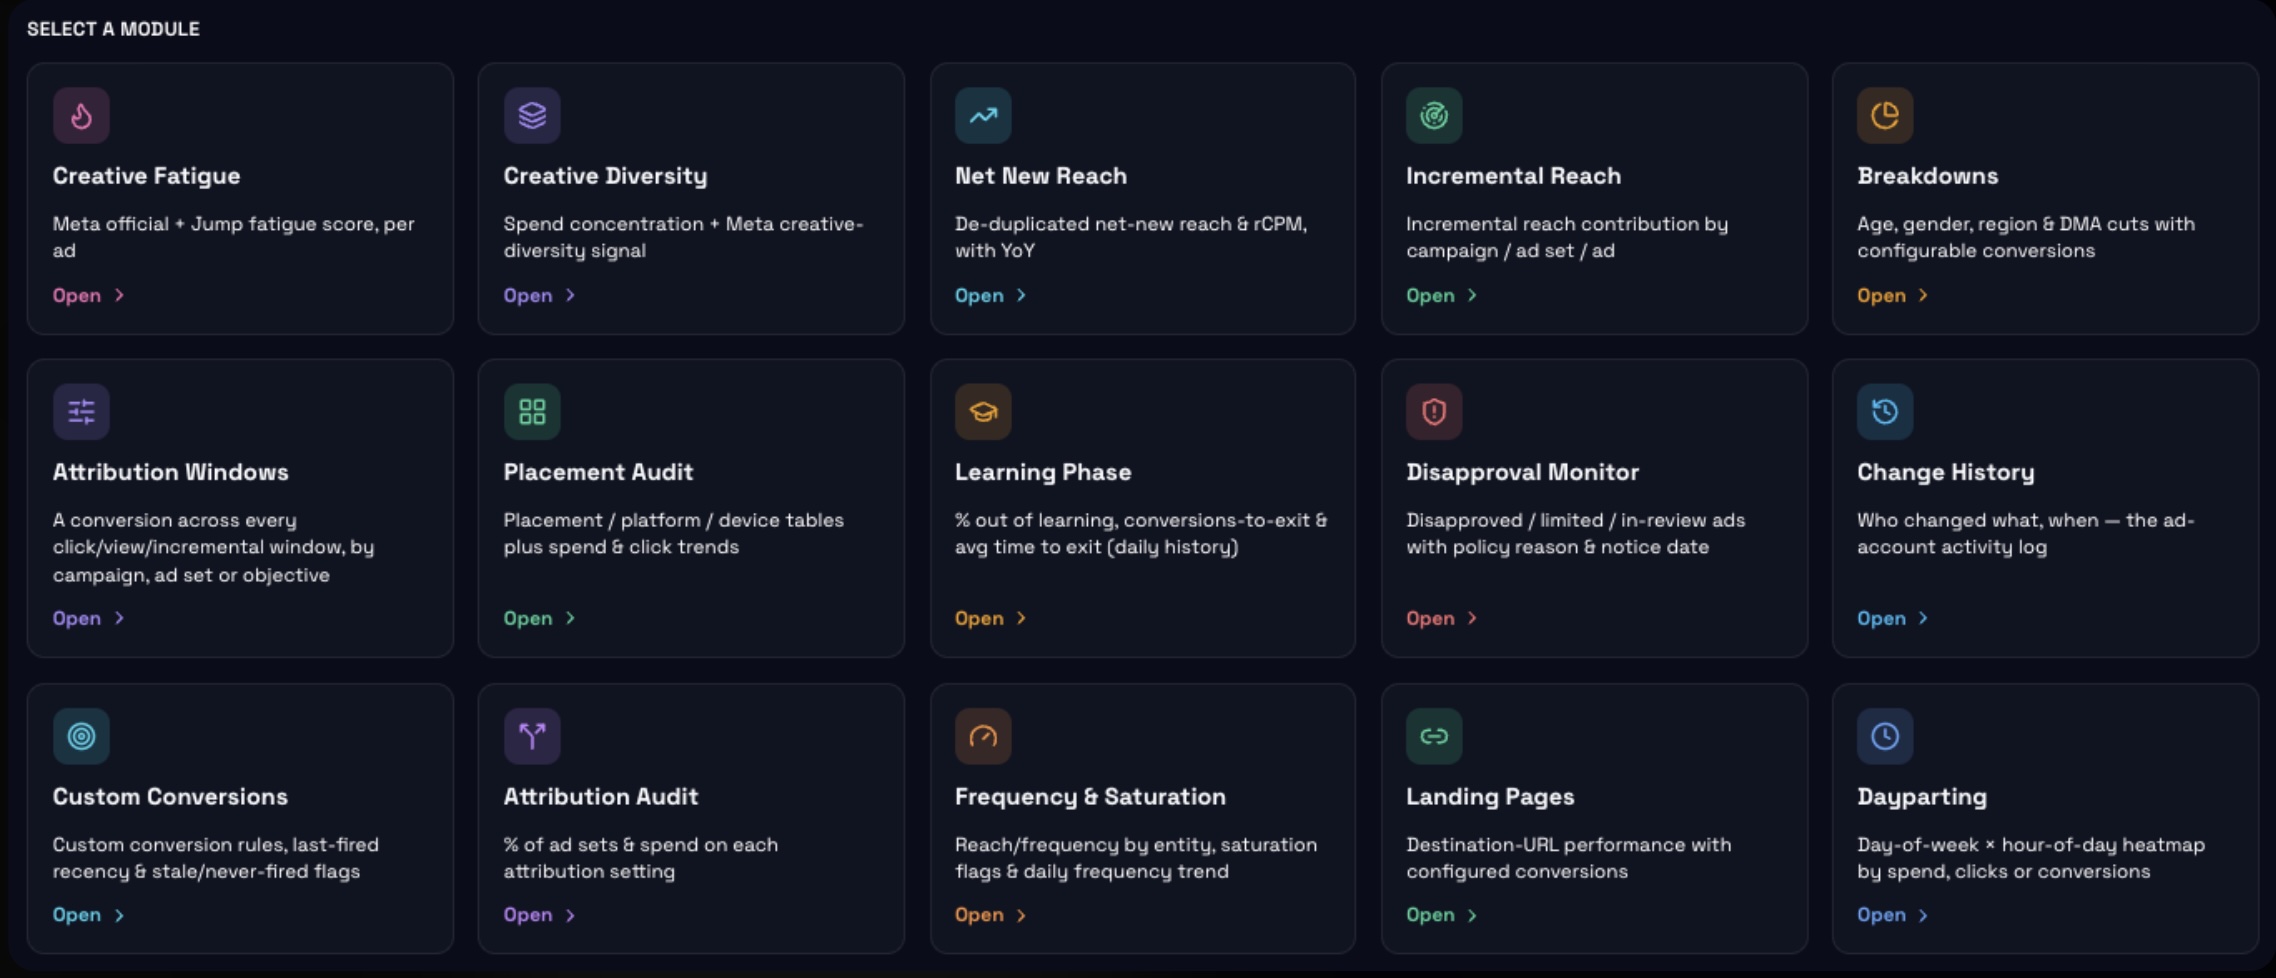
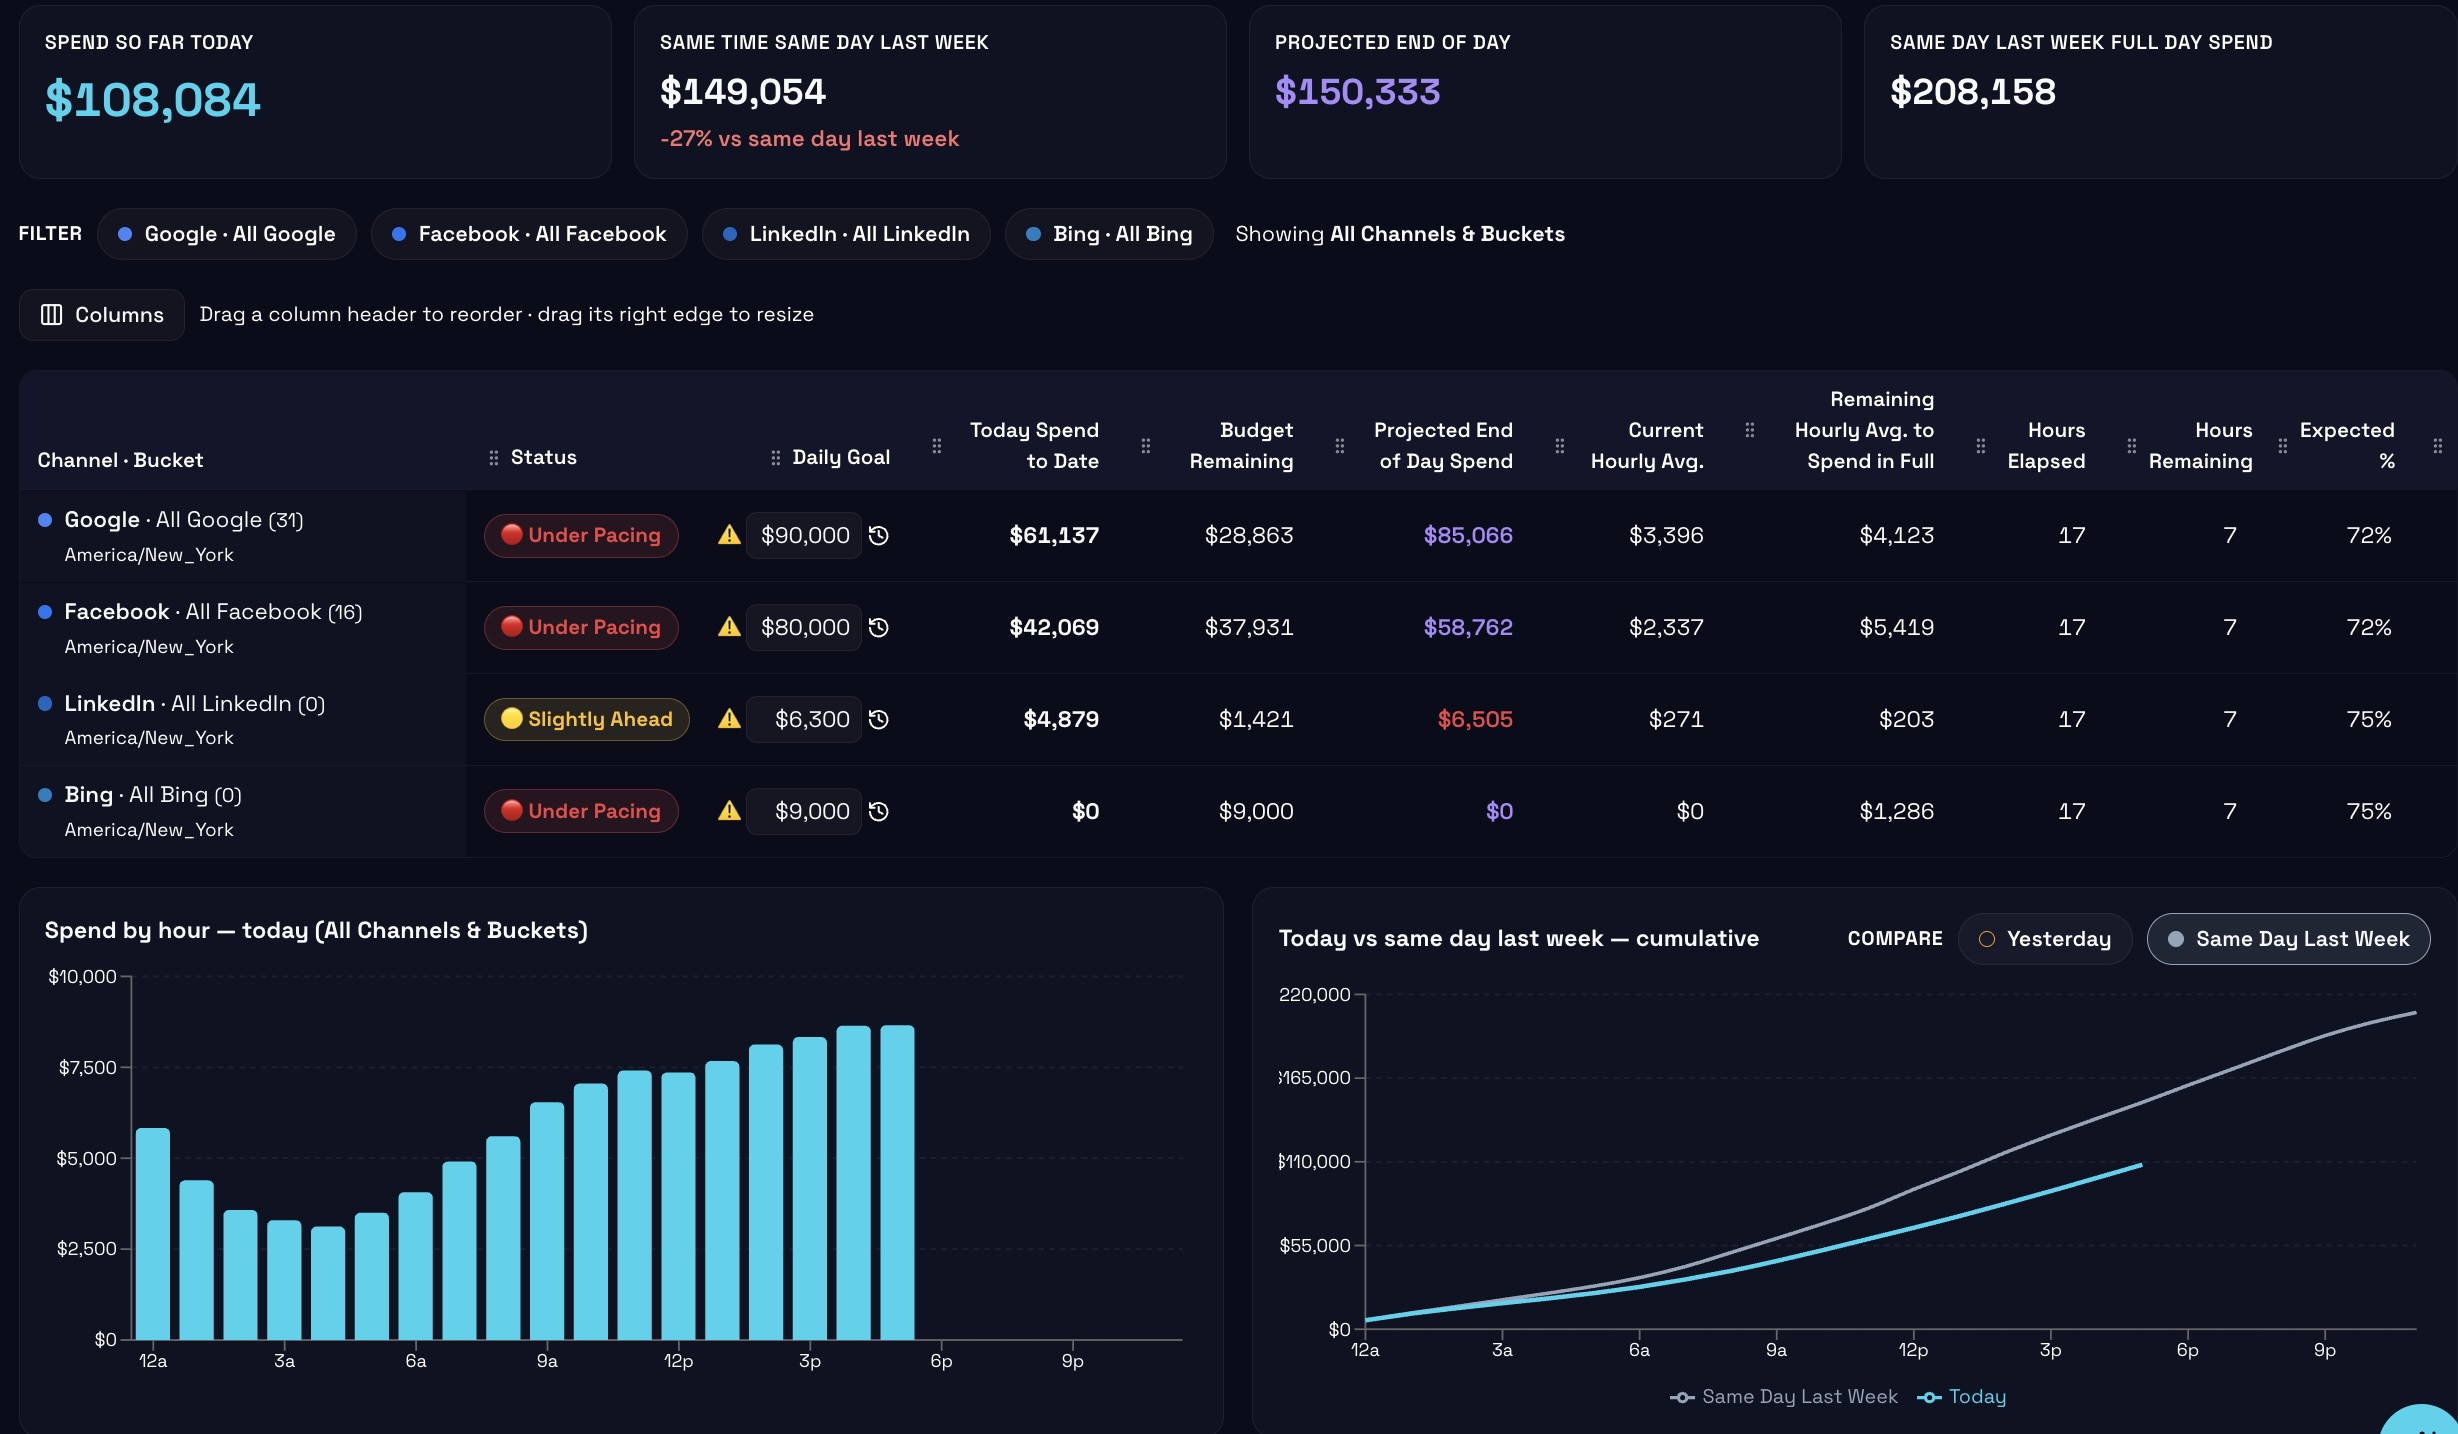
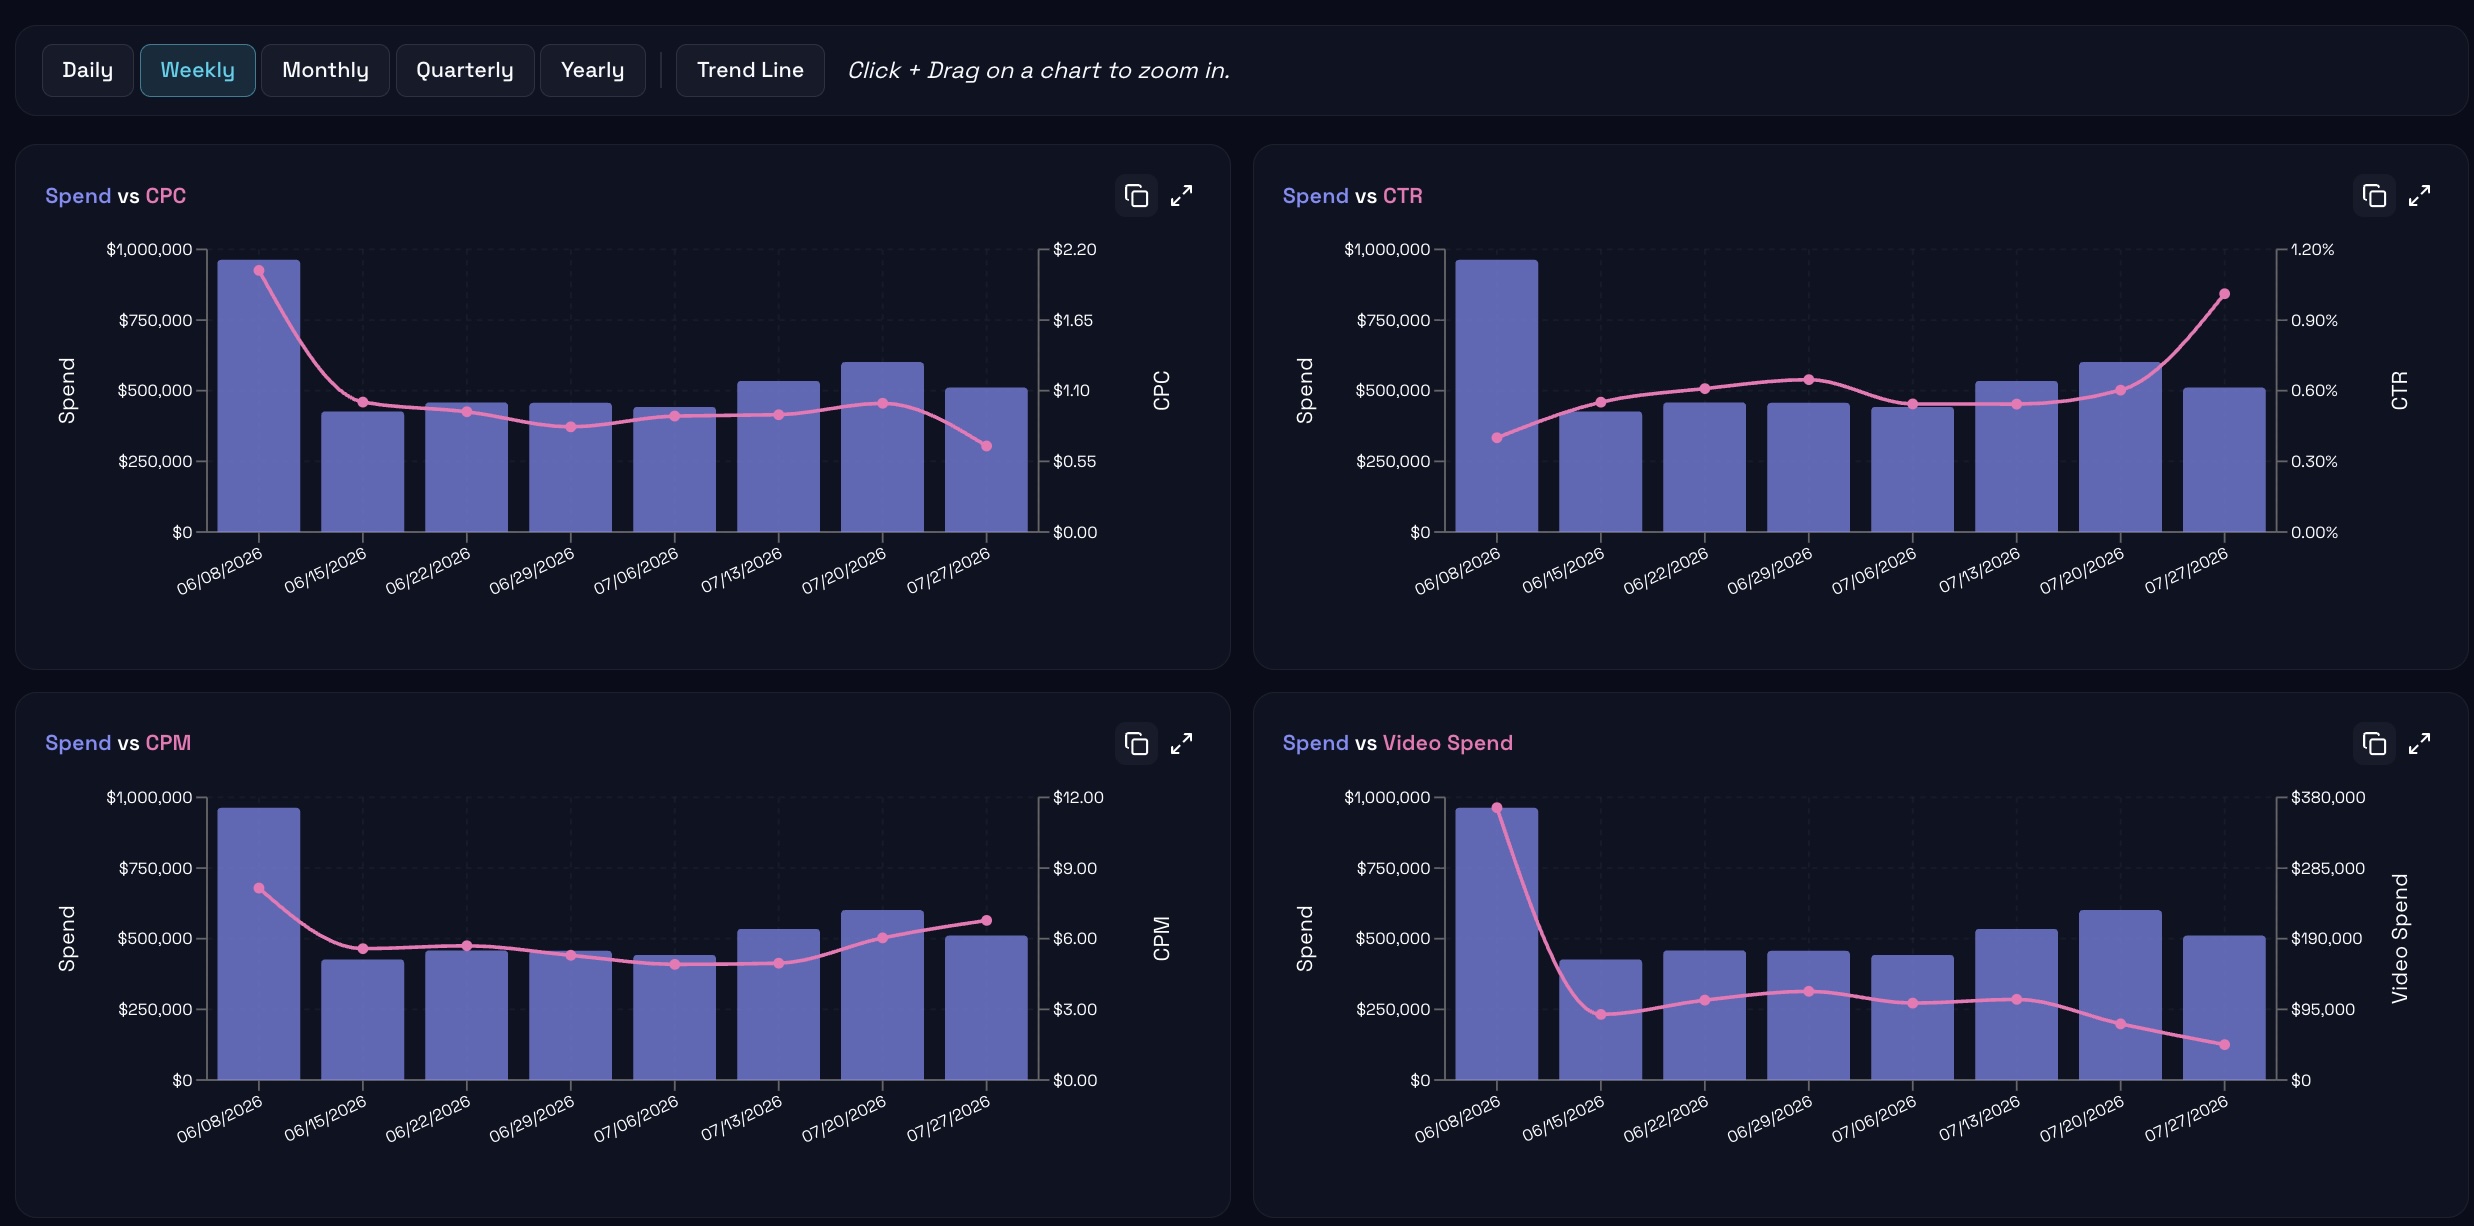
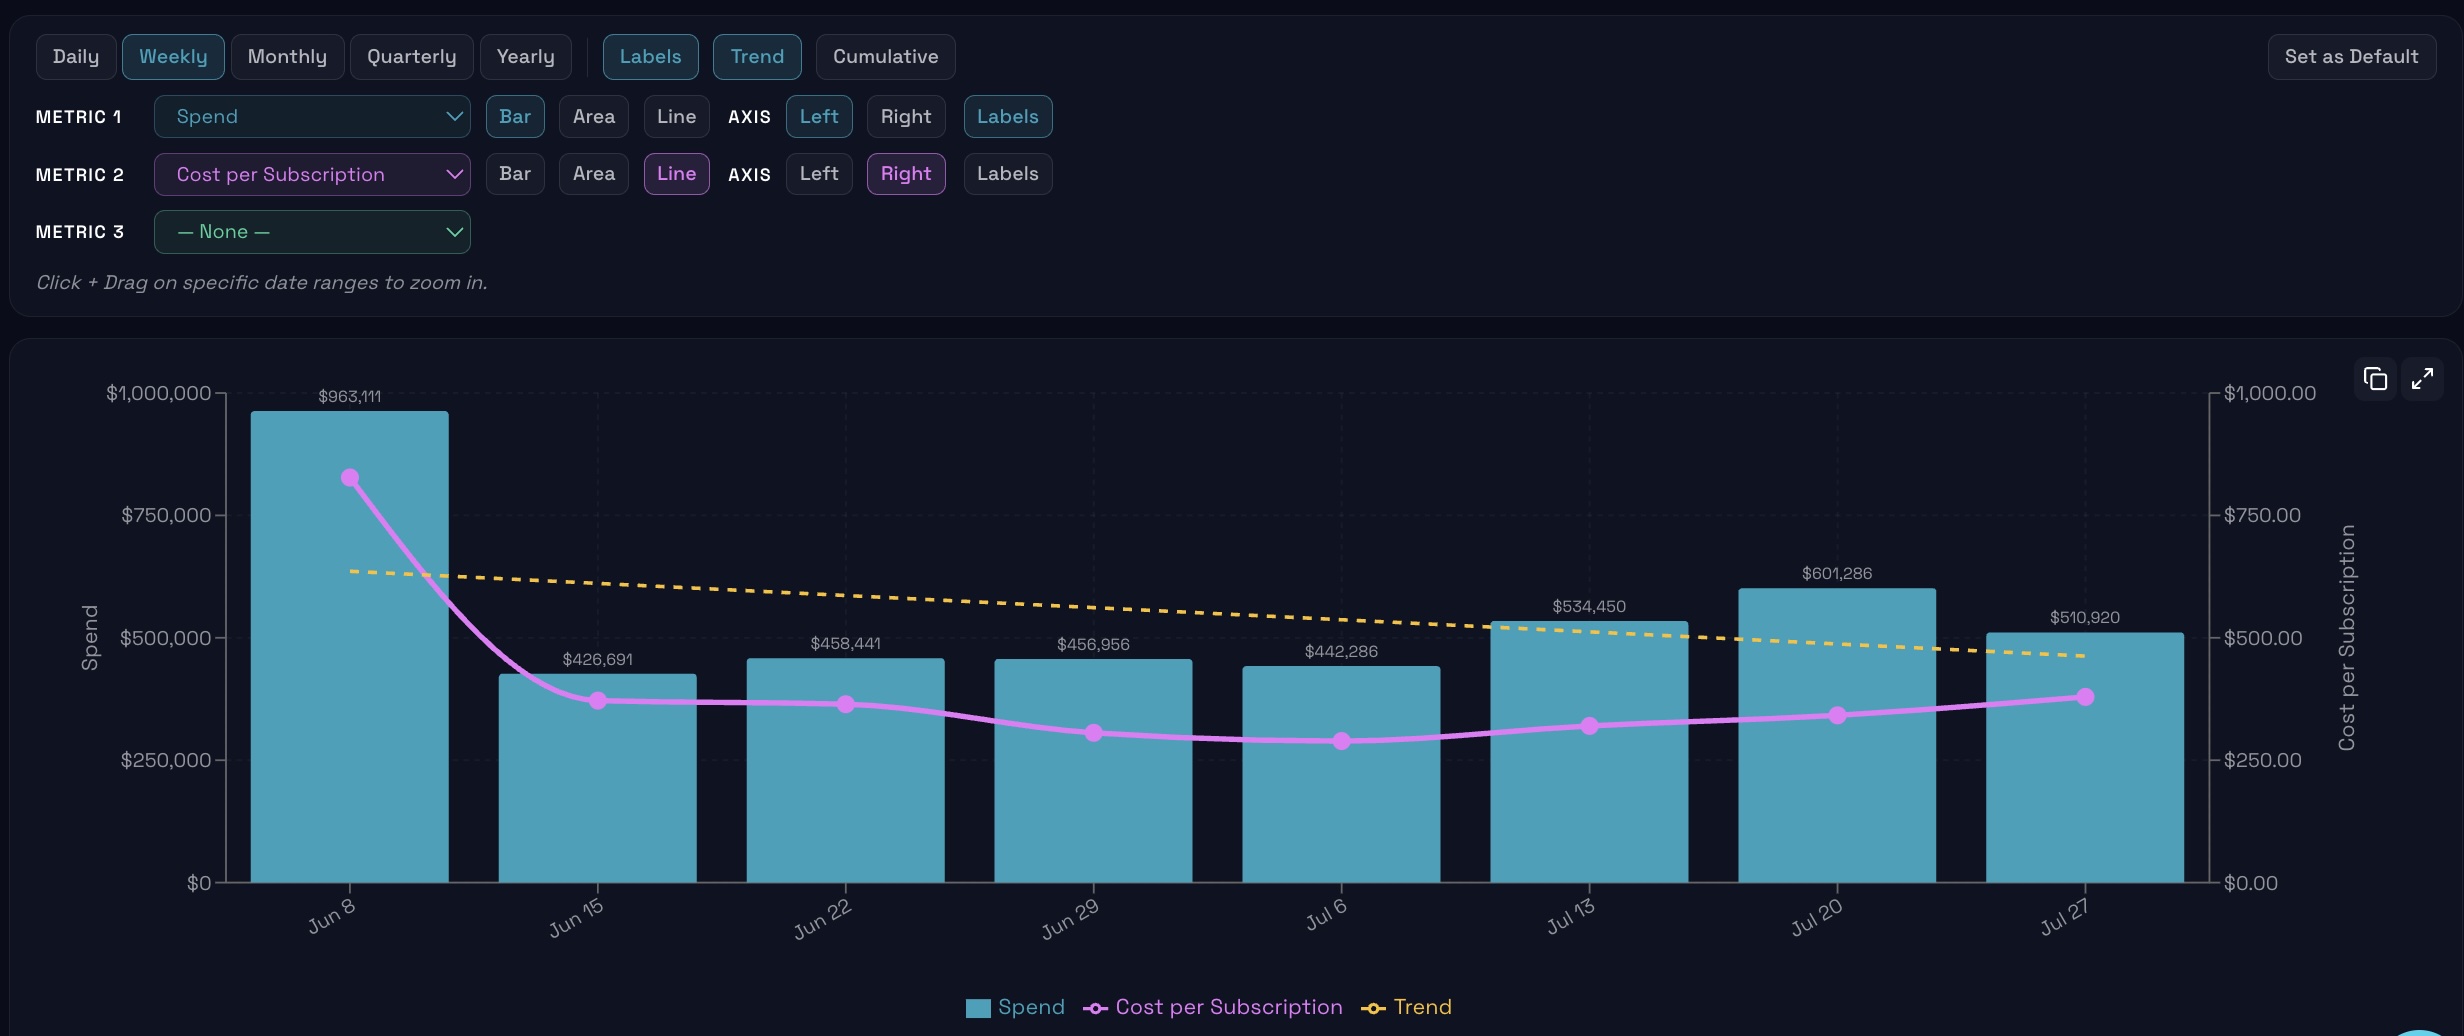
Dashboard Preview
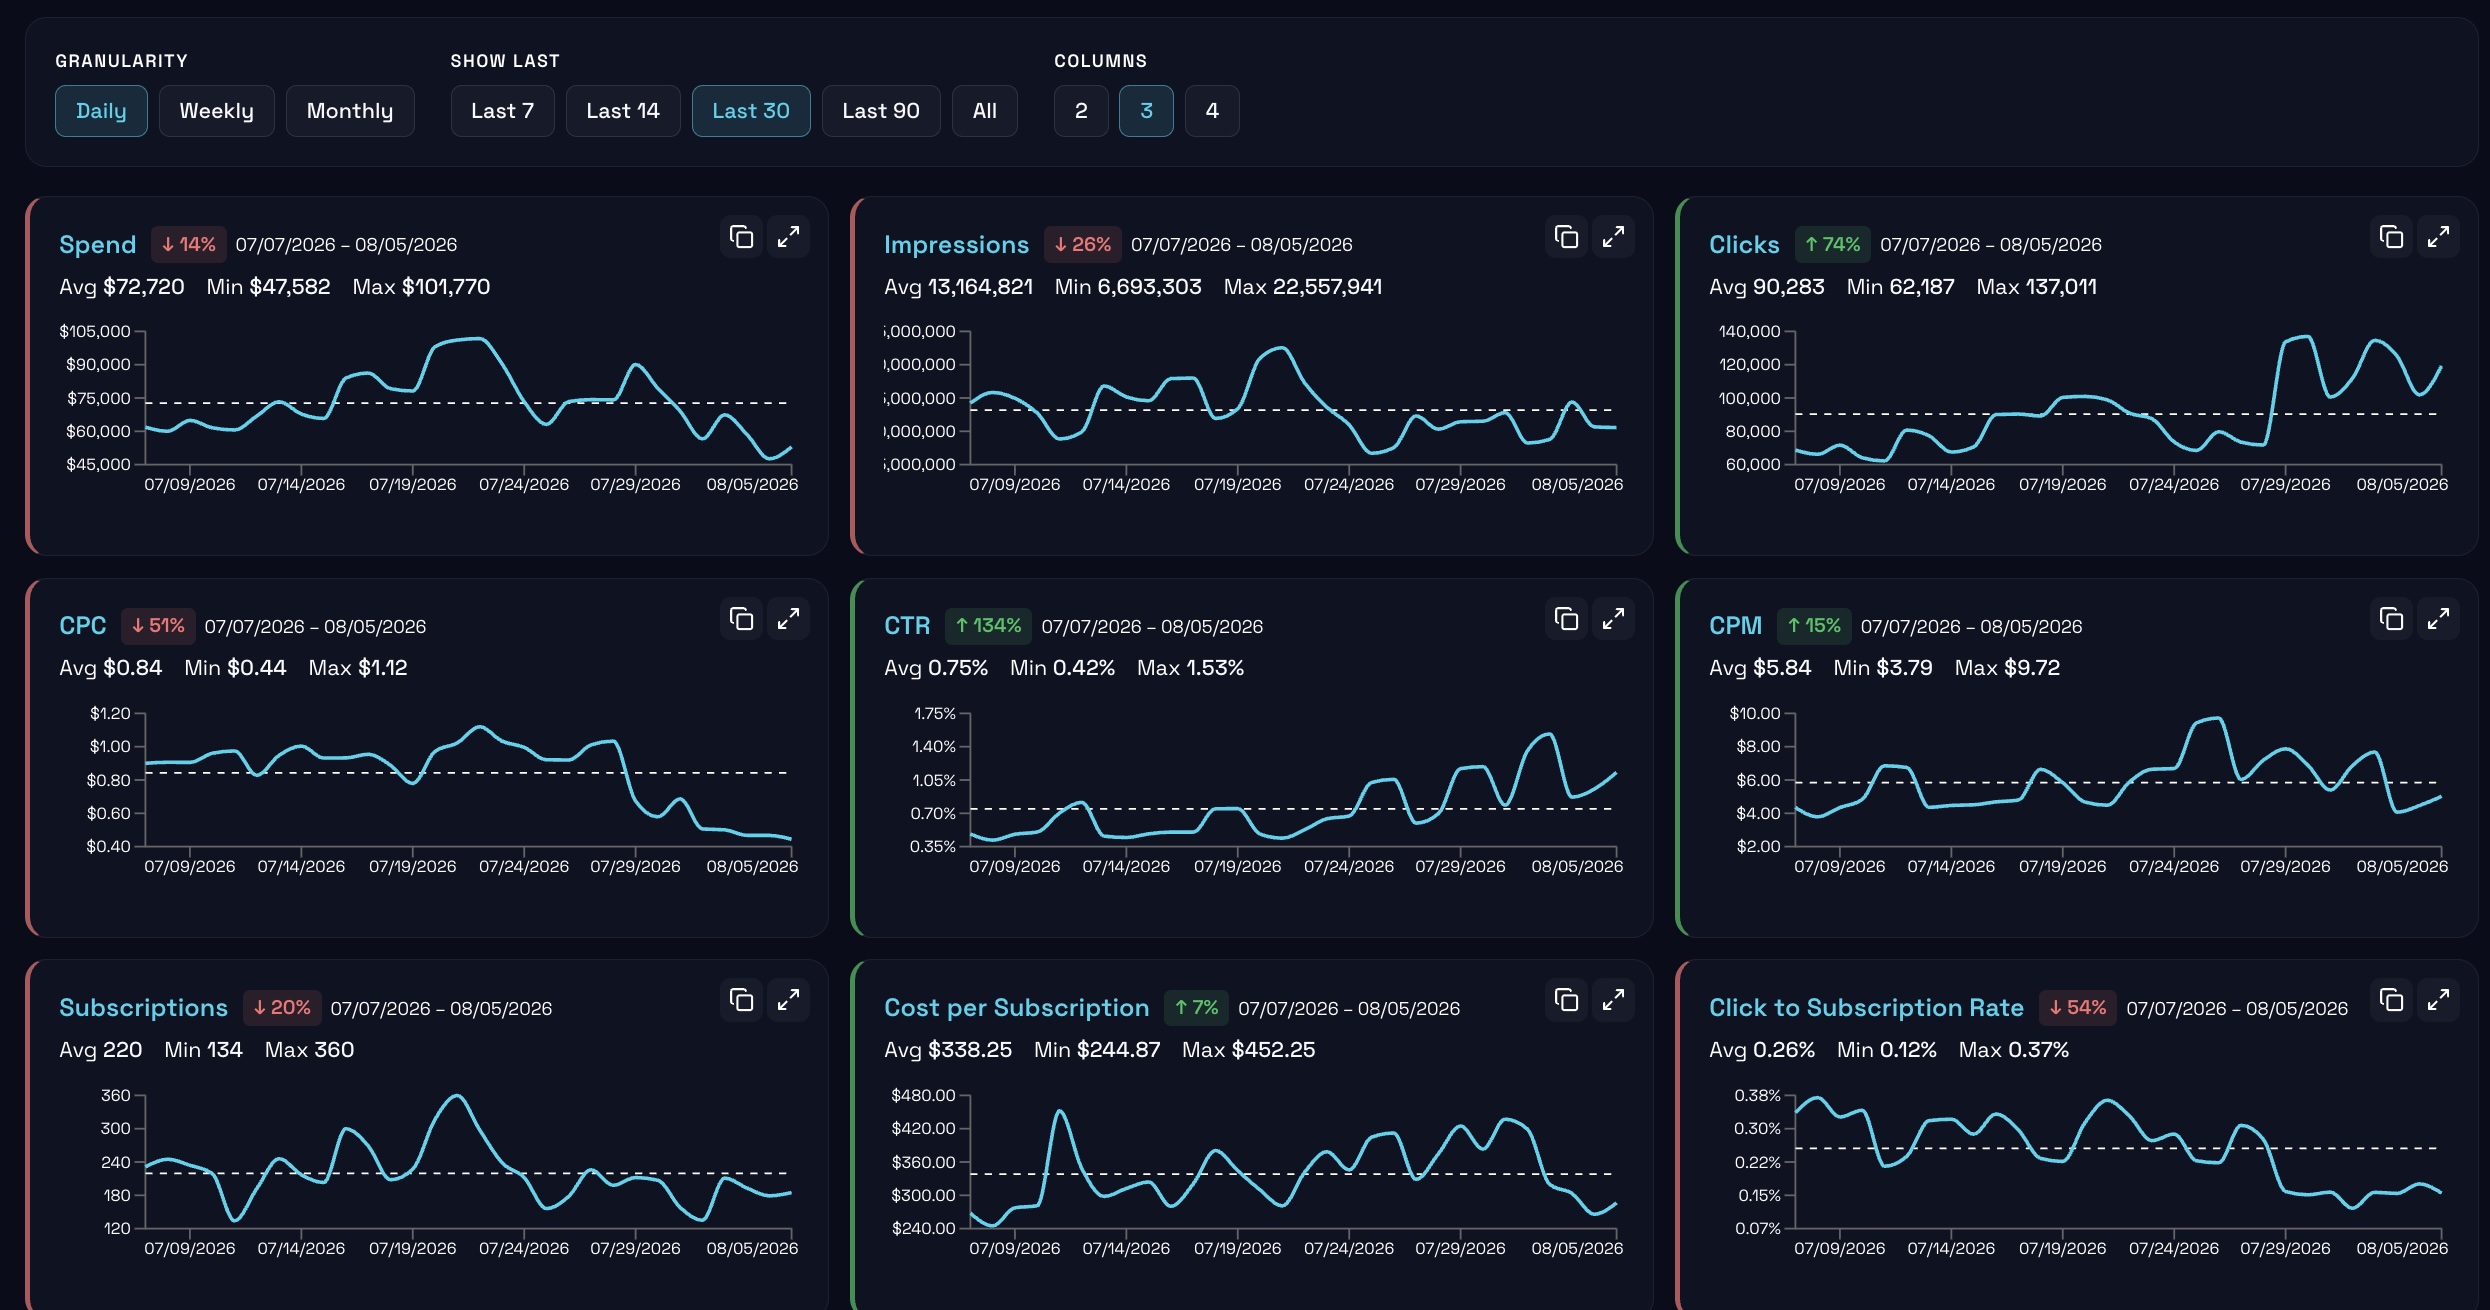
Built to be used daily — not just looked at.
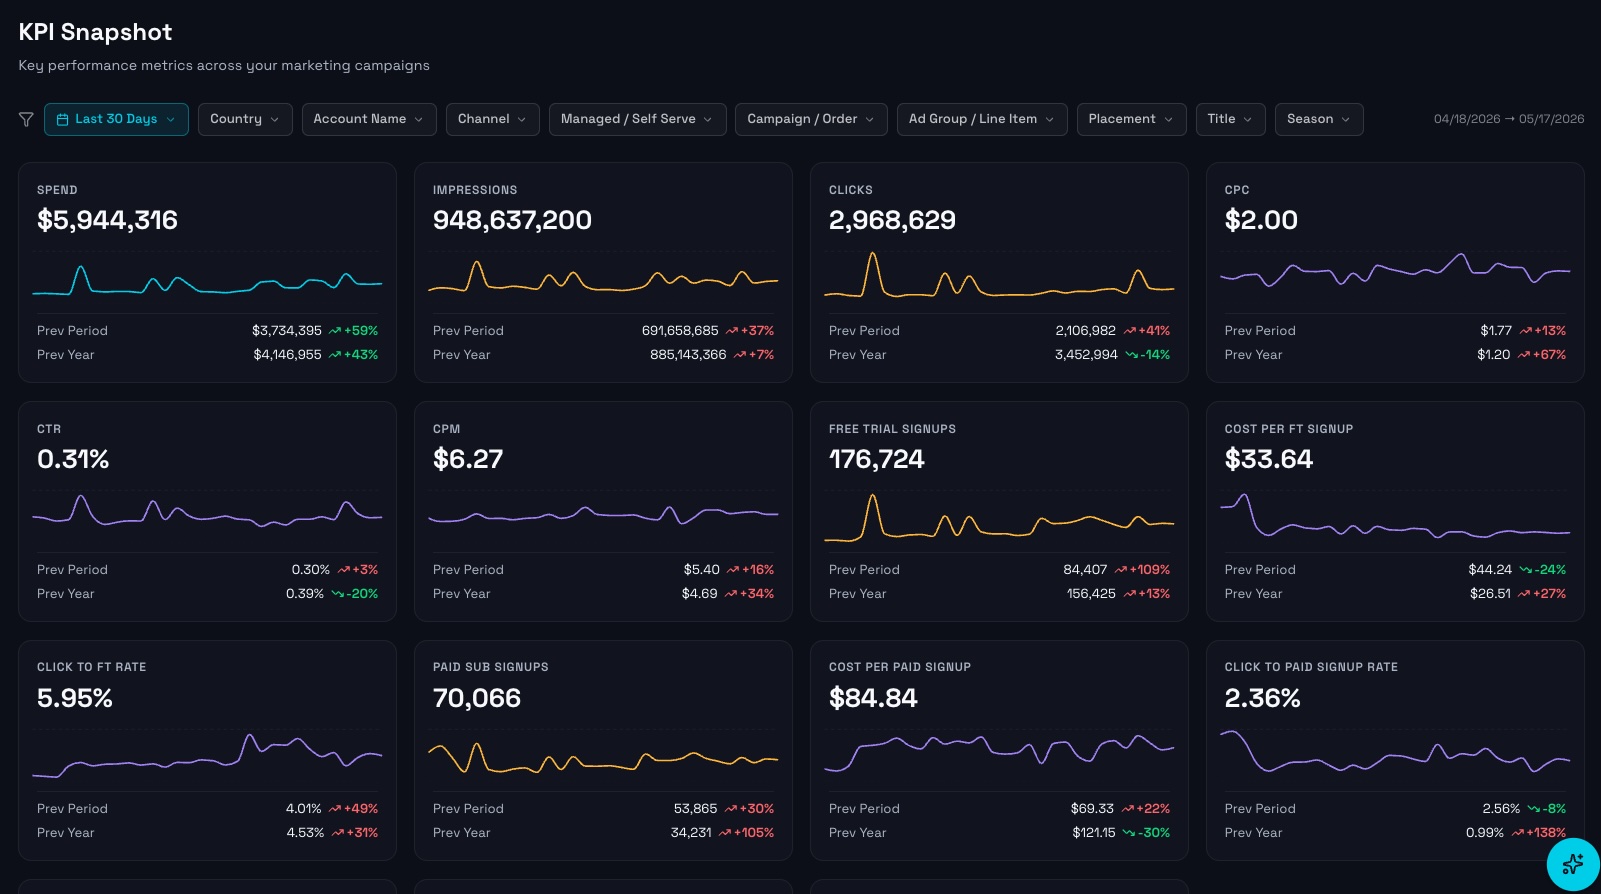
Anomaly Detection & Alerts
Know the moment something breaks or blooms.
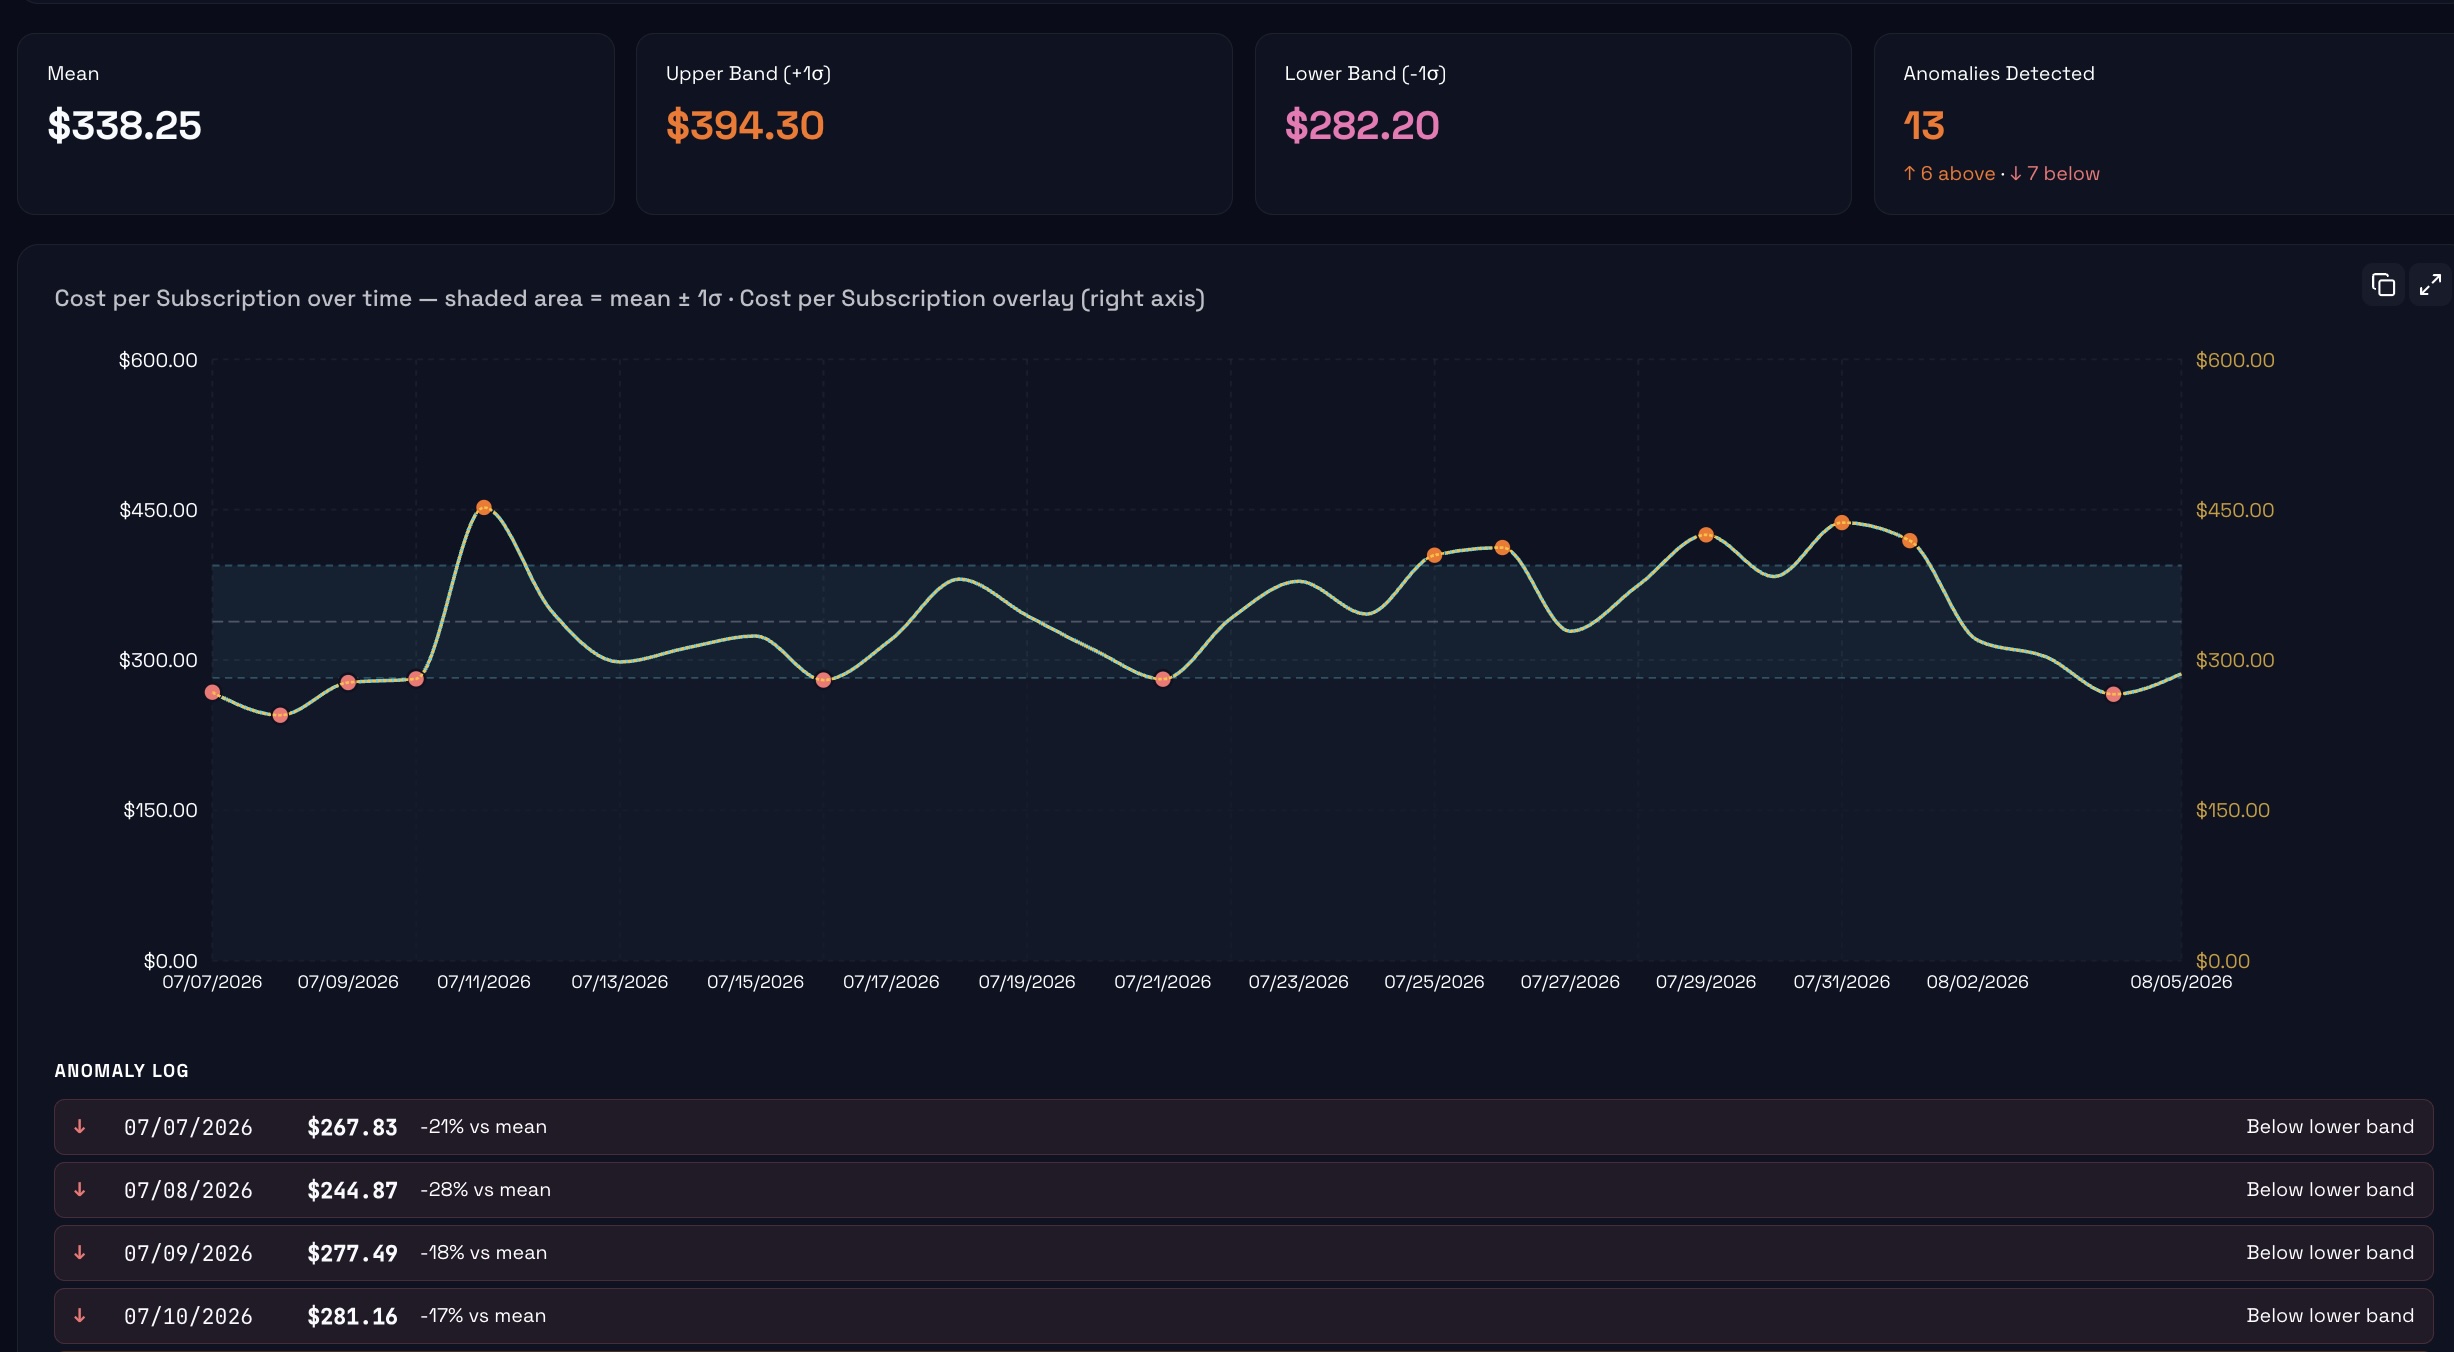
Automated detection across every channel and dimension — the moment performance crosses a critical, optimal, or in-range threshold, the right people are alerted instantly.
⚠ Critical
Threshold crossed — immediate action required.
◆ Optimal
Trending above benchmark — double down now.
✓ In Range
Within expected bounds — system healthy.
Creative Reporting
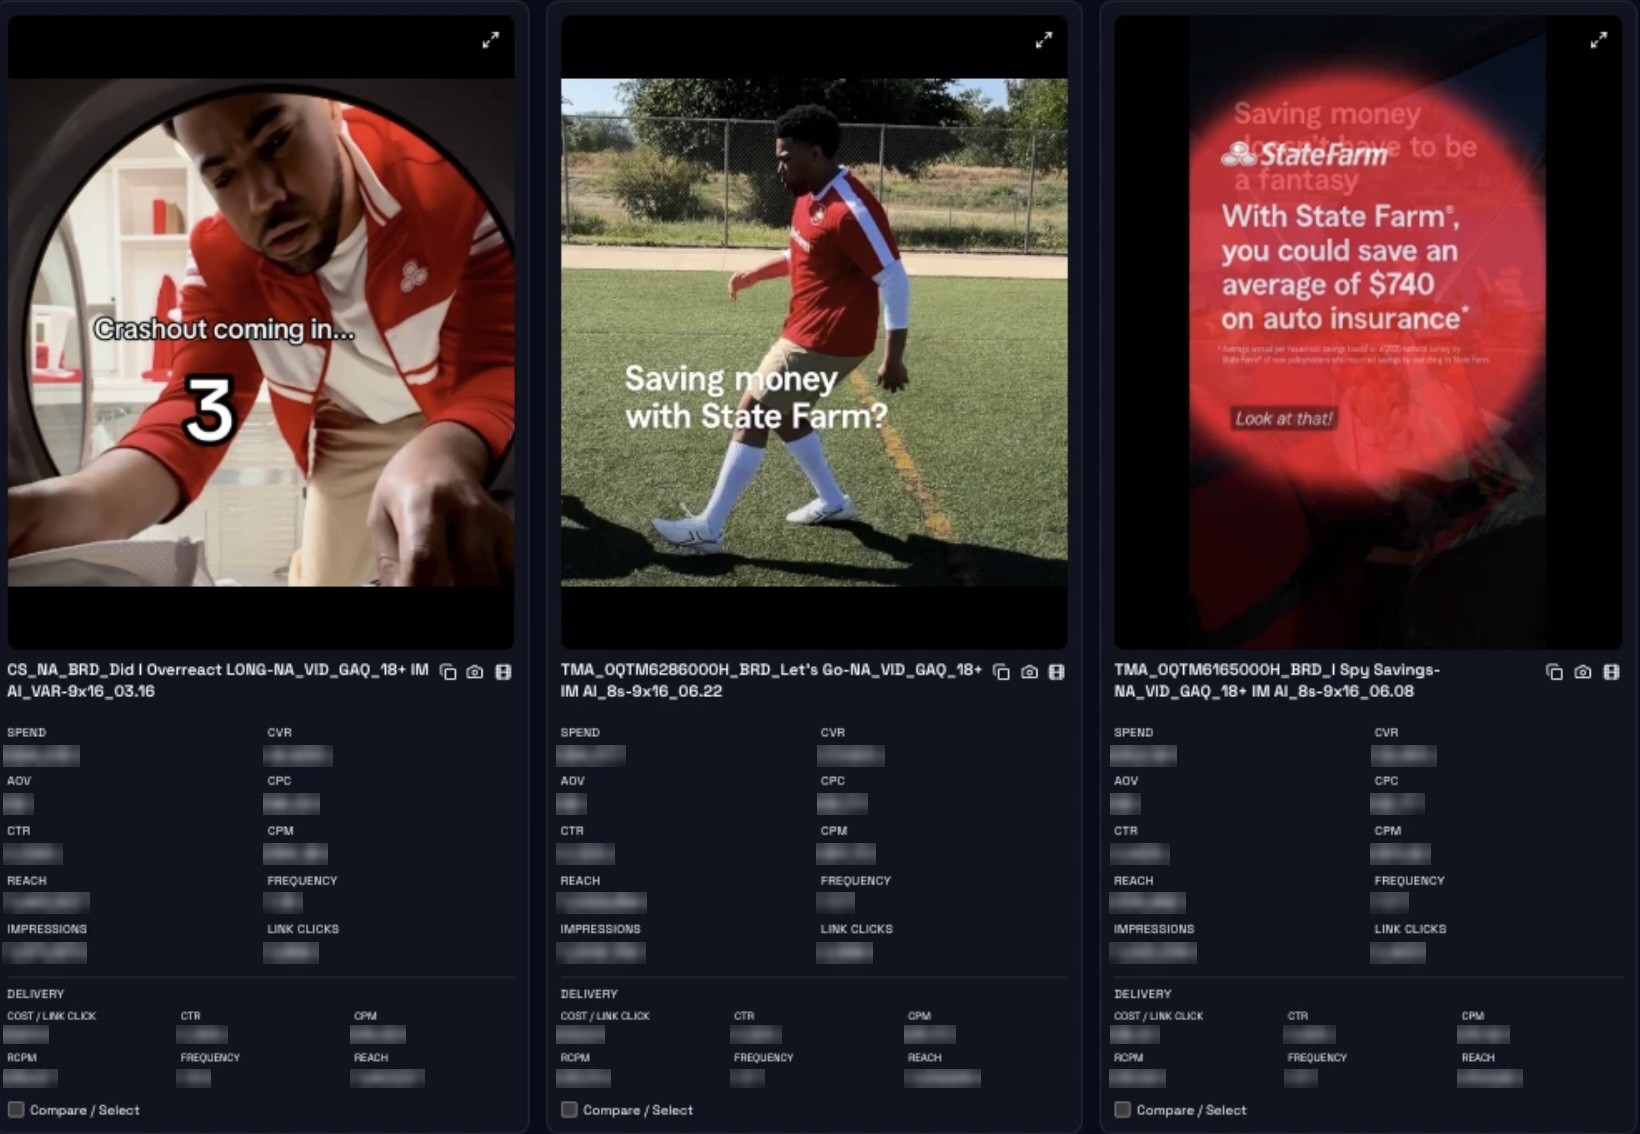
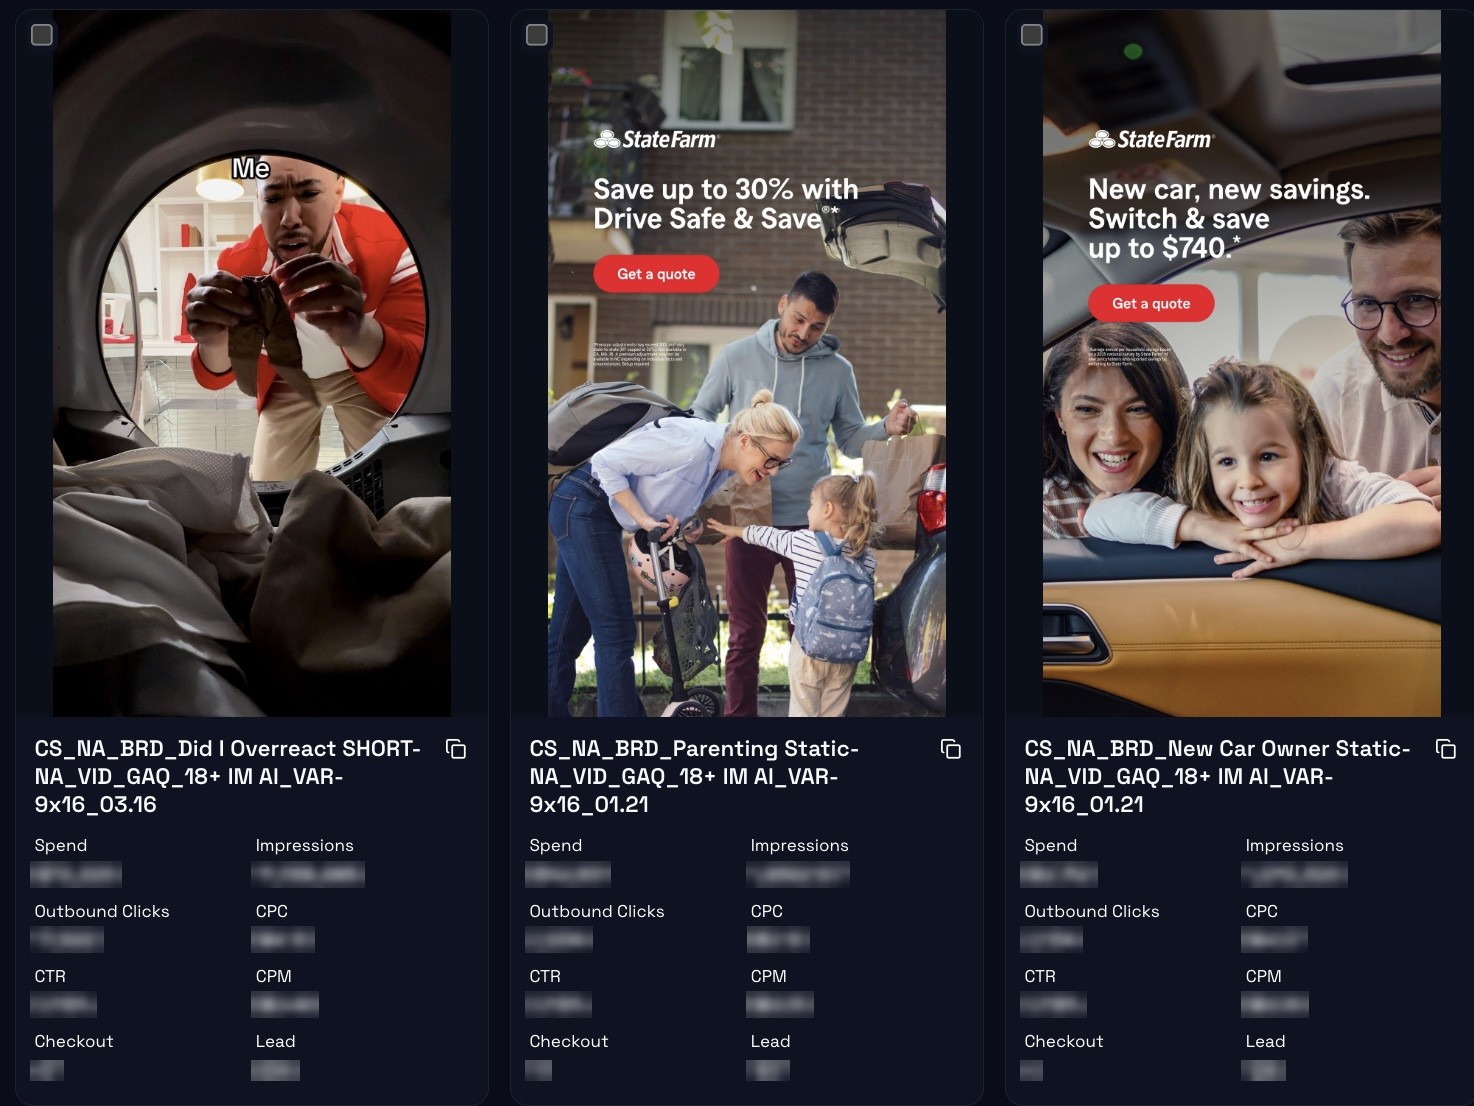
See which creative is actually working.
Every asset, with its full delivery and performance picture side by side — spend, CVR, CPC, CTR, CPM, reach and frequency — without opening a single ad platform.
Internal Benchmarking
Know what good
actually looks like.
actually looks like.
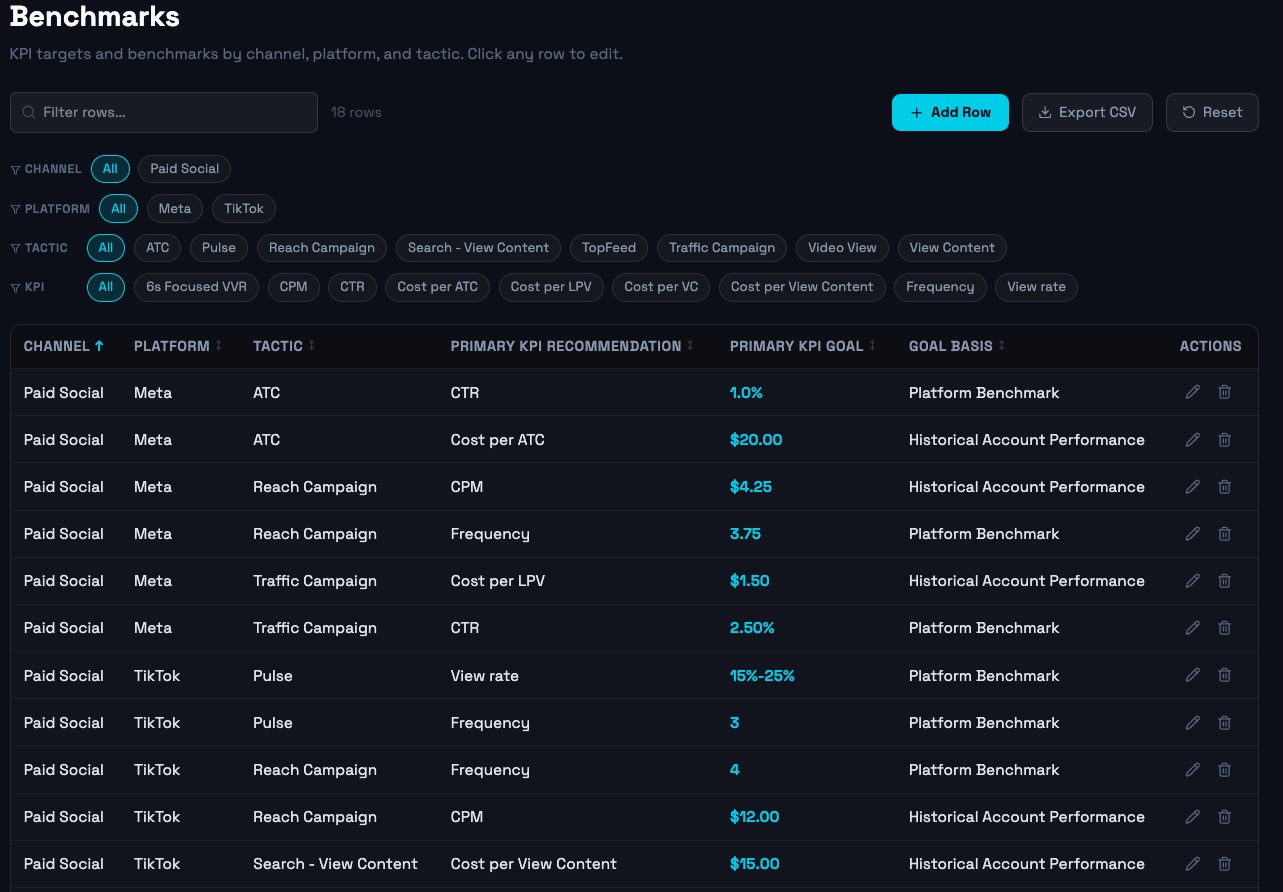
KPI targets and benchmarks defined by channel, platform, and tactic — grounded in your own historical account performance and real platform data, not random industry averages.
Historical Account Performance
Benchmarks derived from your actual campaign history — what your account has demonstrated it can achieve, by tactic and channel.
Platform Benchmarks
Contextual platform-level benchmarks layered in alongside account performance — so you always know how you compare.
Filterable by Channel → Platform → Tactic → KPI
Drill from total account down to a specific tactic and KPI in seconds. Editable targets, exportable to CSV.
Goal Setting
Targets grounded in reality.
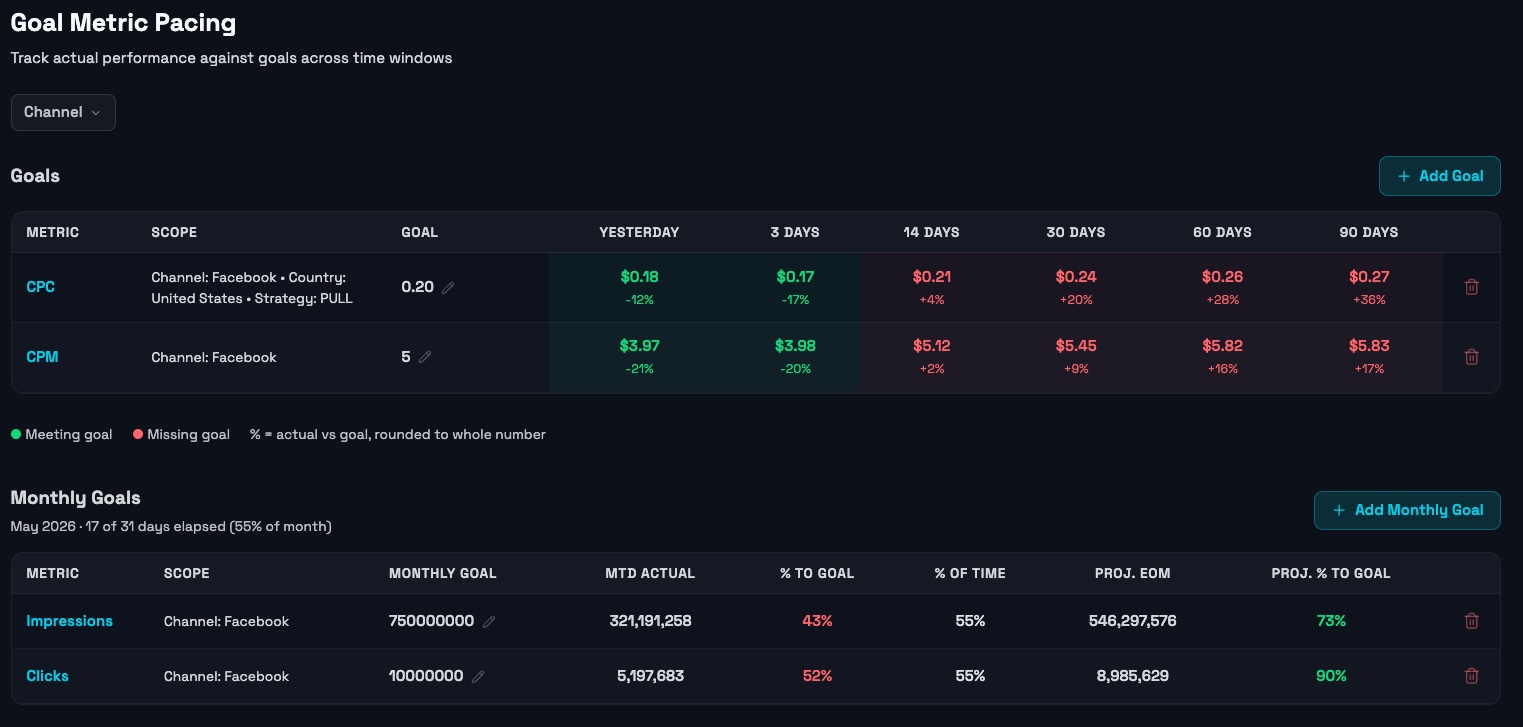
Set metric goals rooted in your internal benchmarks. Track performance against those targets across rolling time windows — from yesterday through 90 days.
Rolling Windows
Yesterday · 3 Days · 14 Days · 30 Days · 60 Days · 90 Days — see trend direction at a glance with green/red goal delta coloring.
Monthly Goals
MTD actual vs monthly goal, % to goal, % of time elapsed, and projected EOM performance — all in one view.
Scoped by Dimension
Goals can be scoped to any dimension — Channel, Platform, Country, Strategy — so targets are always contextually relevant.
Budget & Goal Pacing
Always know where you stand mid-flight.
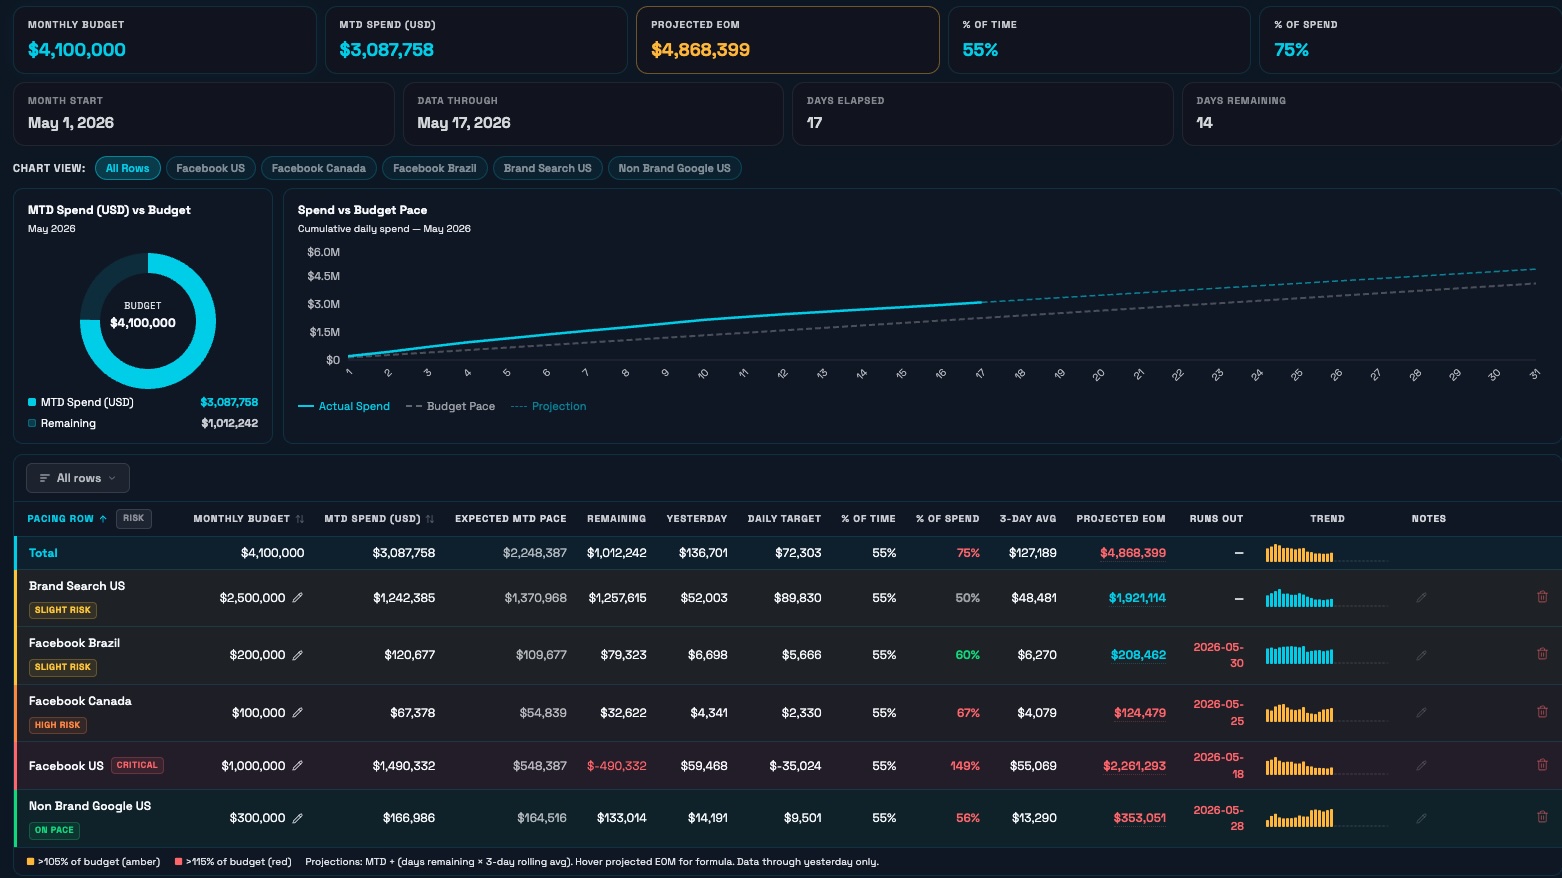
Real-time budget pacing with projected EOM spend, risk flags, daily targets, and a budget pressure heatmap — so nothing surprises you at month end.
Automated Slack Alerts
Spikes, anomalies, and opportunities — pushed to you.
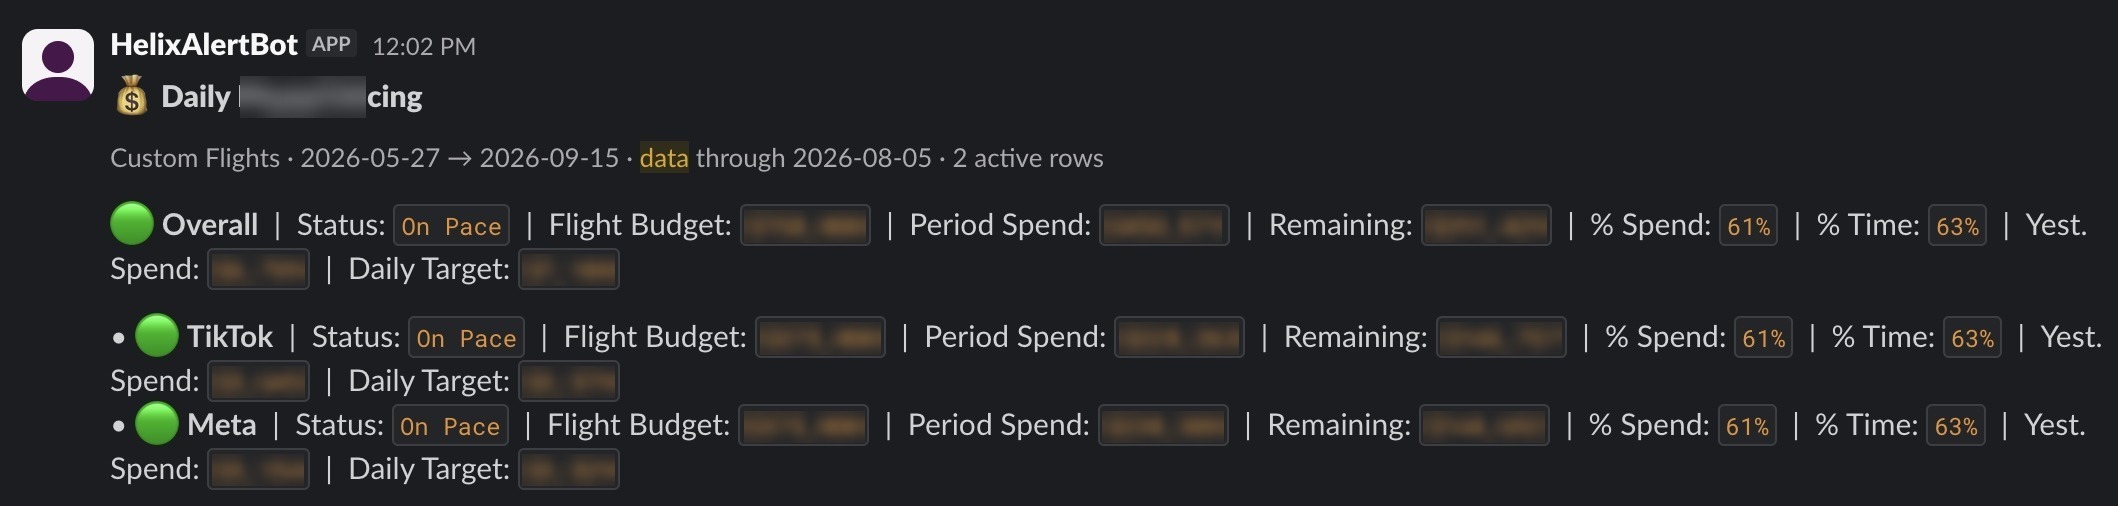
The data comes to your team in Slack. No one has to remember to go look for it.
01
One alert, many checks
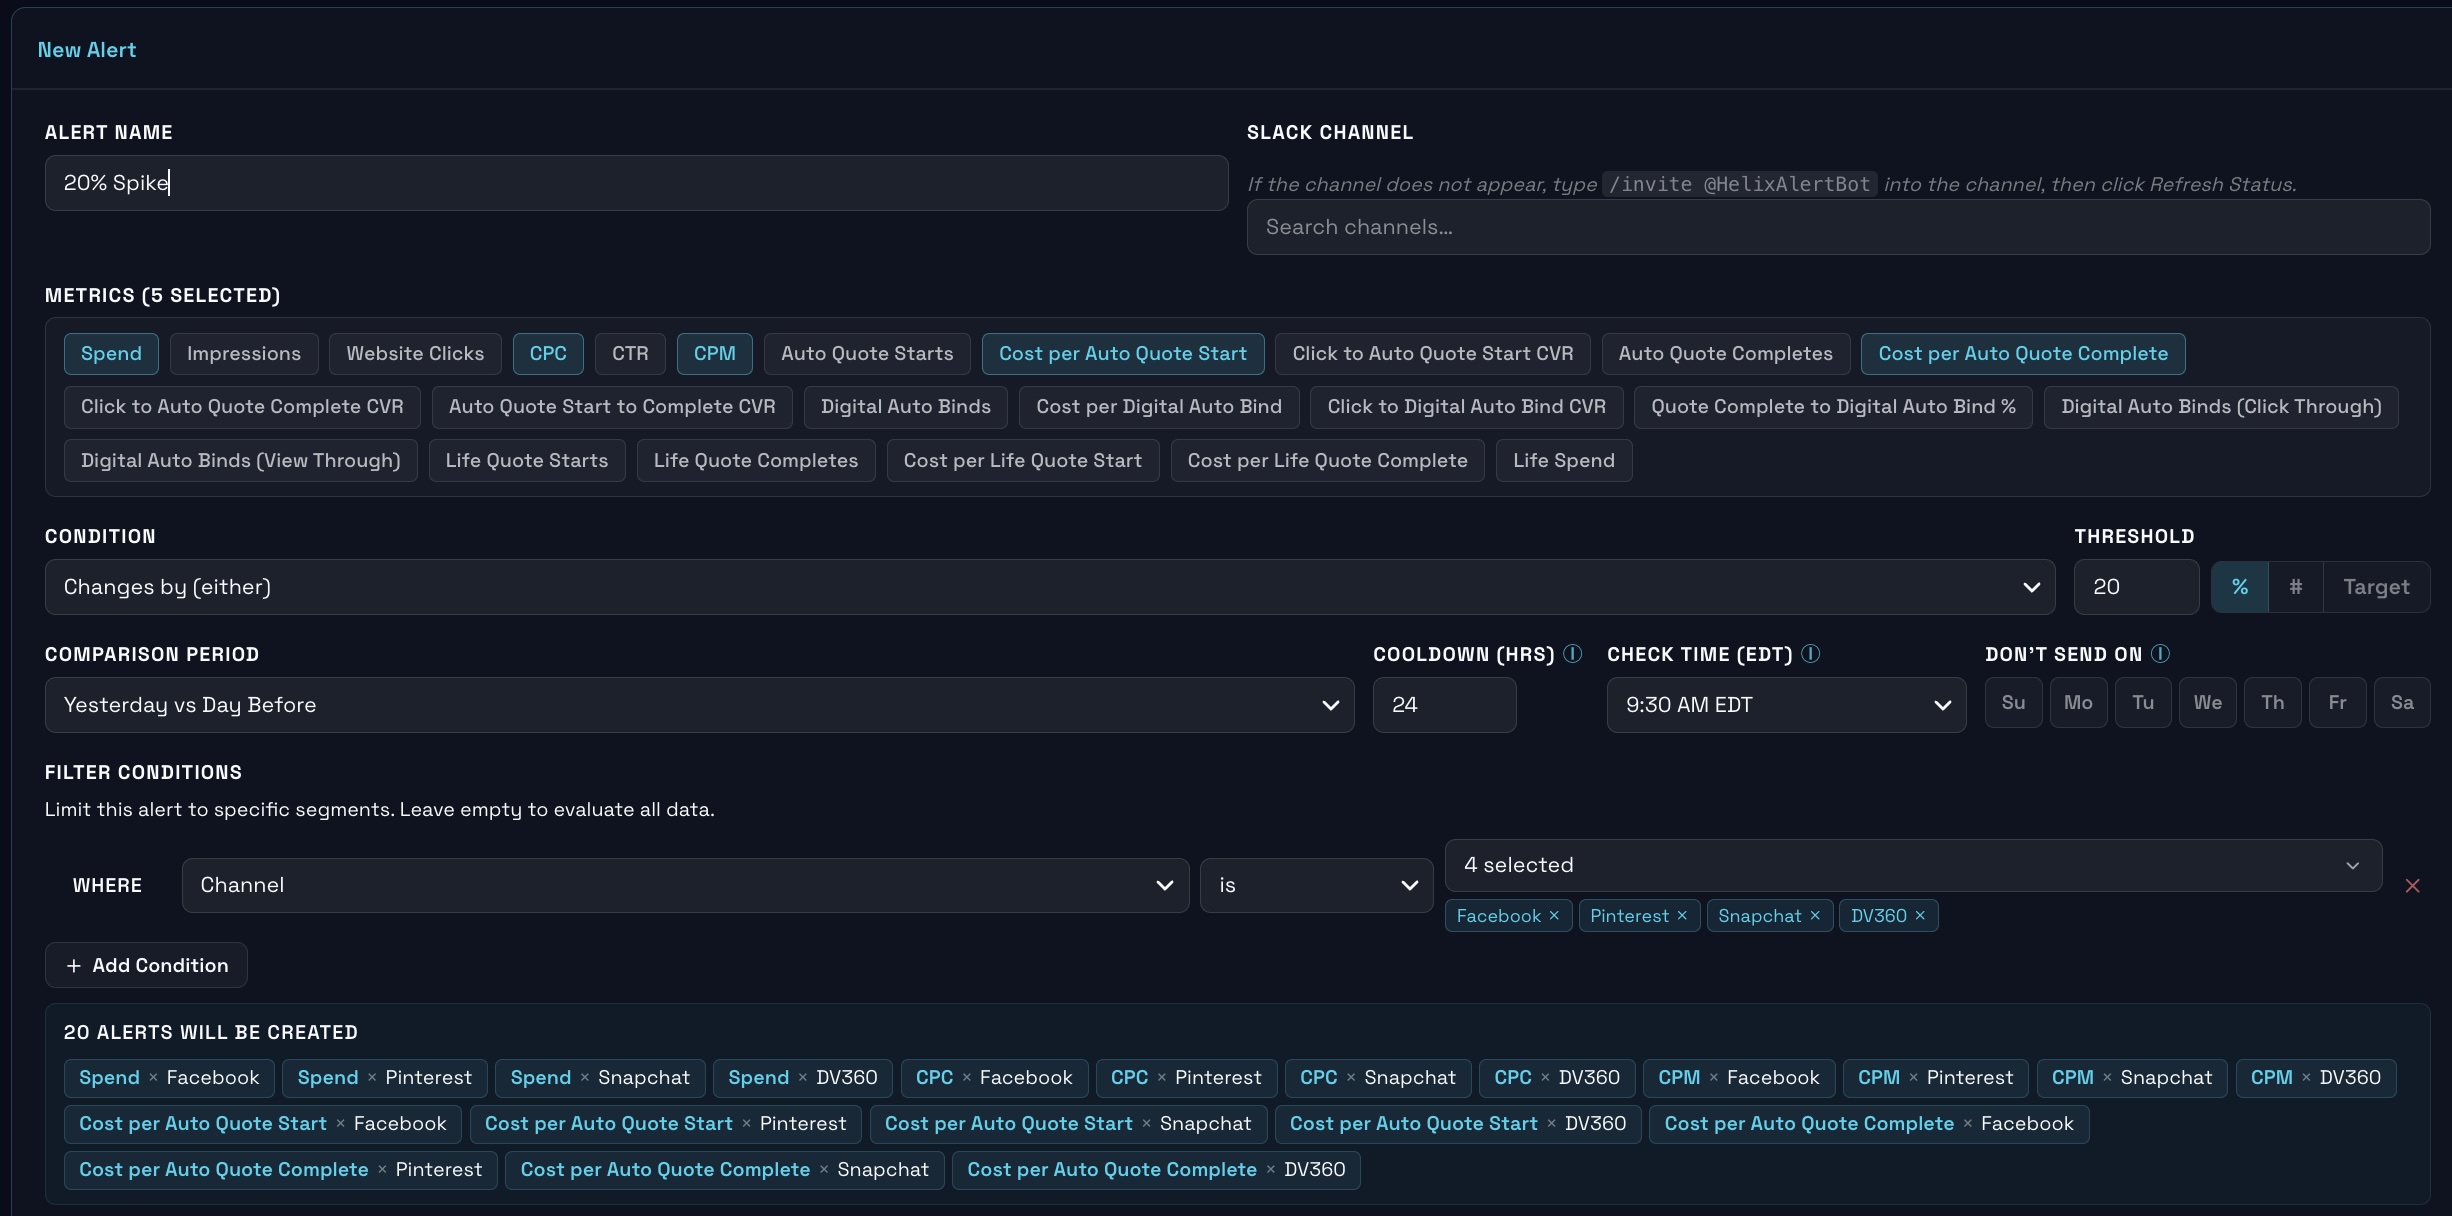
A single alert can watch multiple conditions at once — 4 metrics across 5 channels is 20 checks running for you, not 20 alerts to set up.
02
Spike detection
Get called out the moment something jumps day-over-day or week-over-week — while there's still time to act on it.
03
Pacing alerts
Alerts driven by how far into the flight you are, how much budget is left, and where spend is projected to land.
04
Scheduled digests
Schedule digests that surface the metrics you care about at set times — so you see the numbers without opening the dashboard.

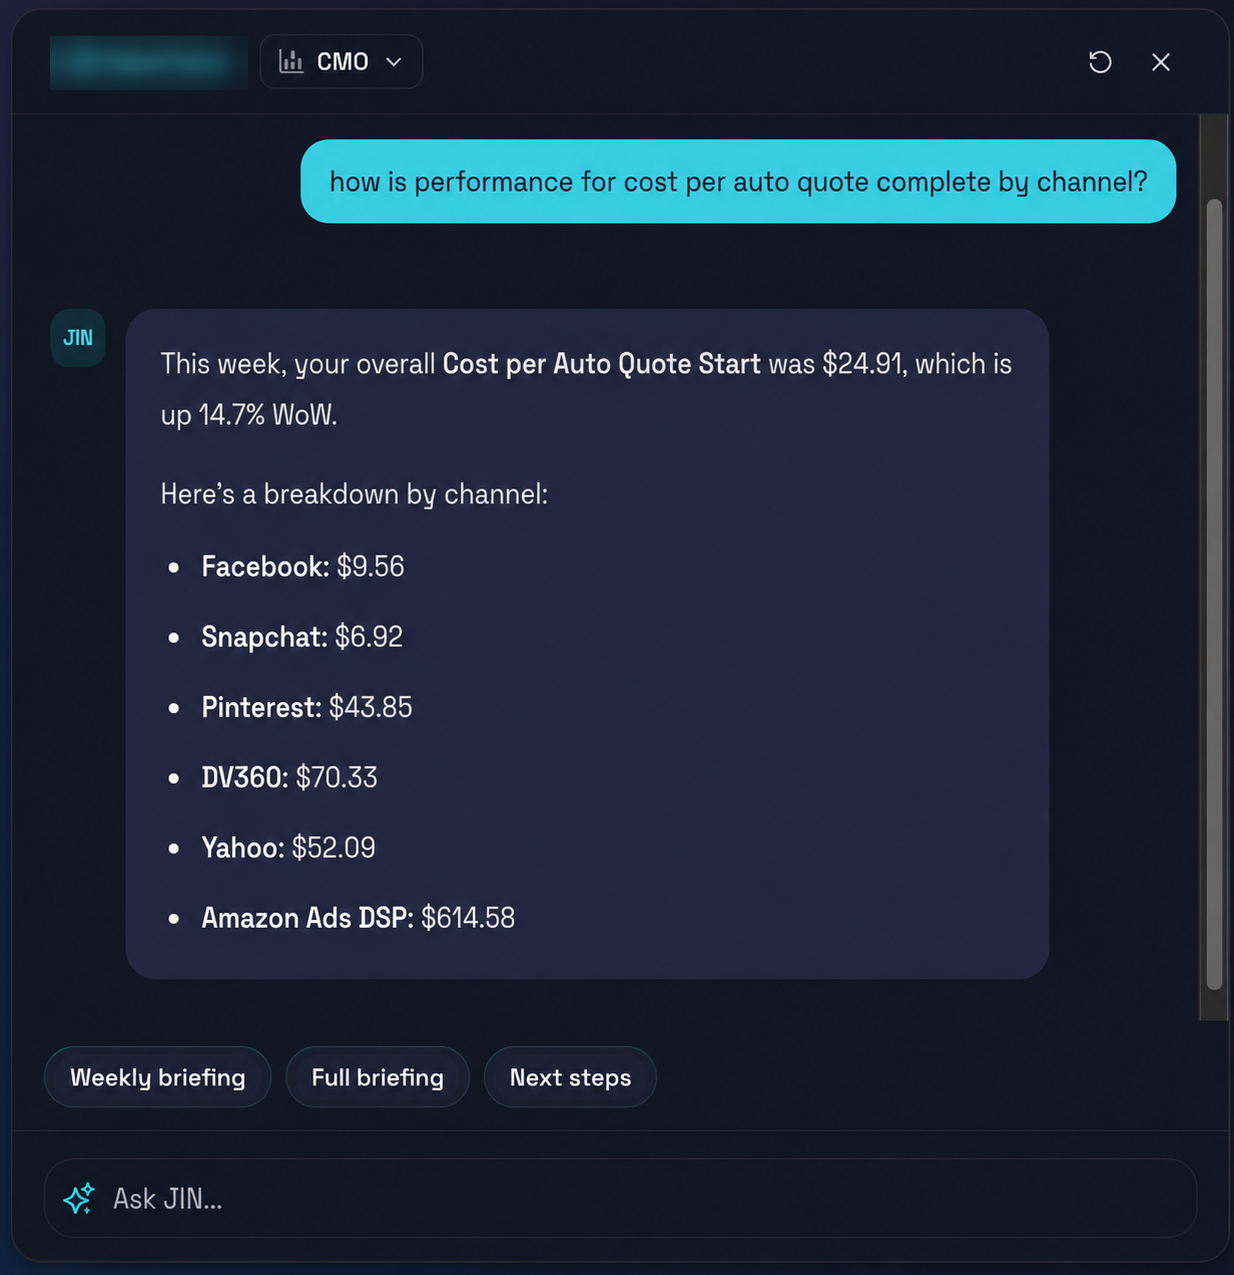
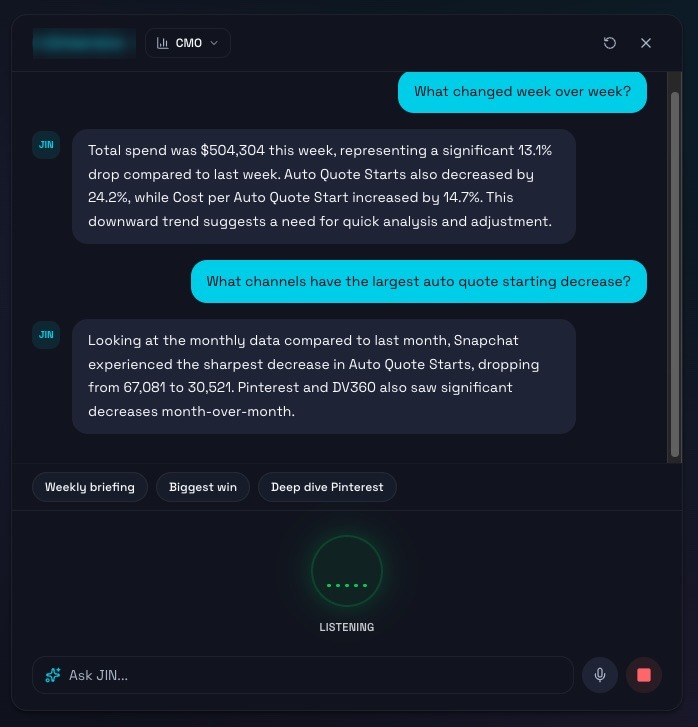
AI Voice & Text Chat
Have a Question? Get an answer. Instantly.
💬
Natural Language Queries
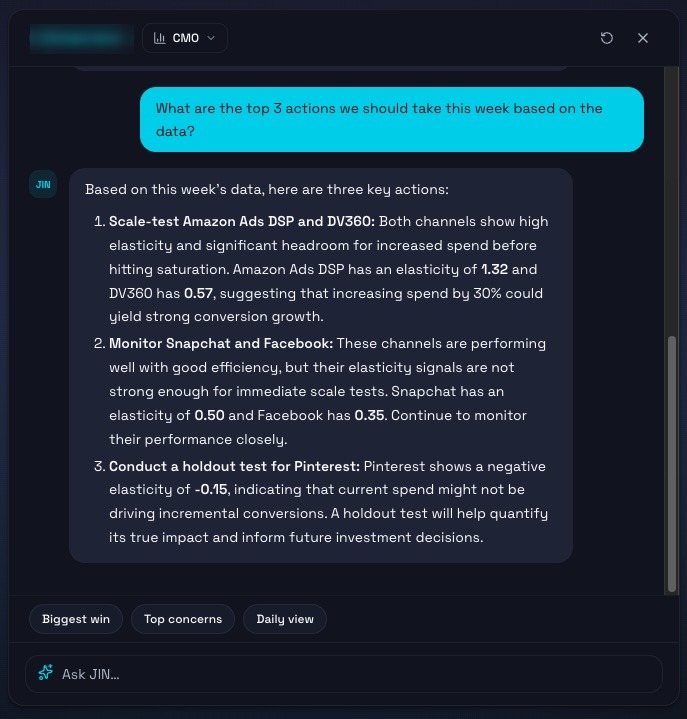
Ask anything in plain English and get a streamed, markdown-formatted answer instantly.
⚡
Custom Modes by Position
Answers tailored to a CMO, VP, or Brand Manager — output matched to how each role thinks.
🎤
Voice & Text Input
Available via text and voice — hands-free performance exploration during calls or reviews.
Appendix
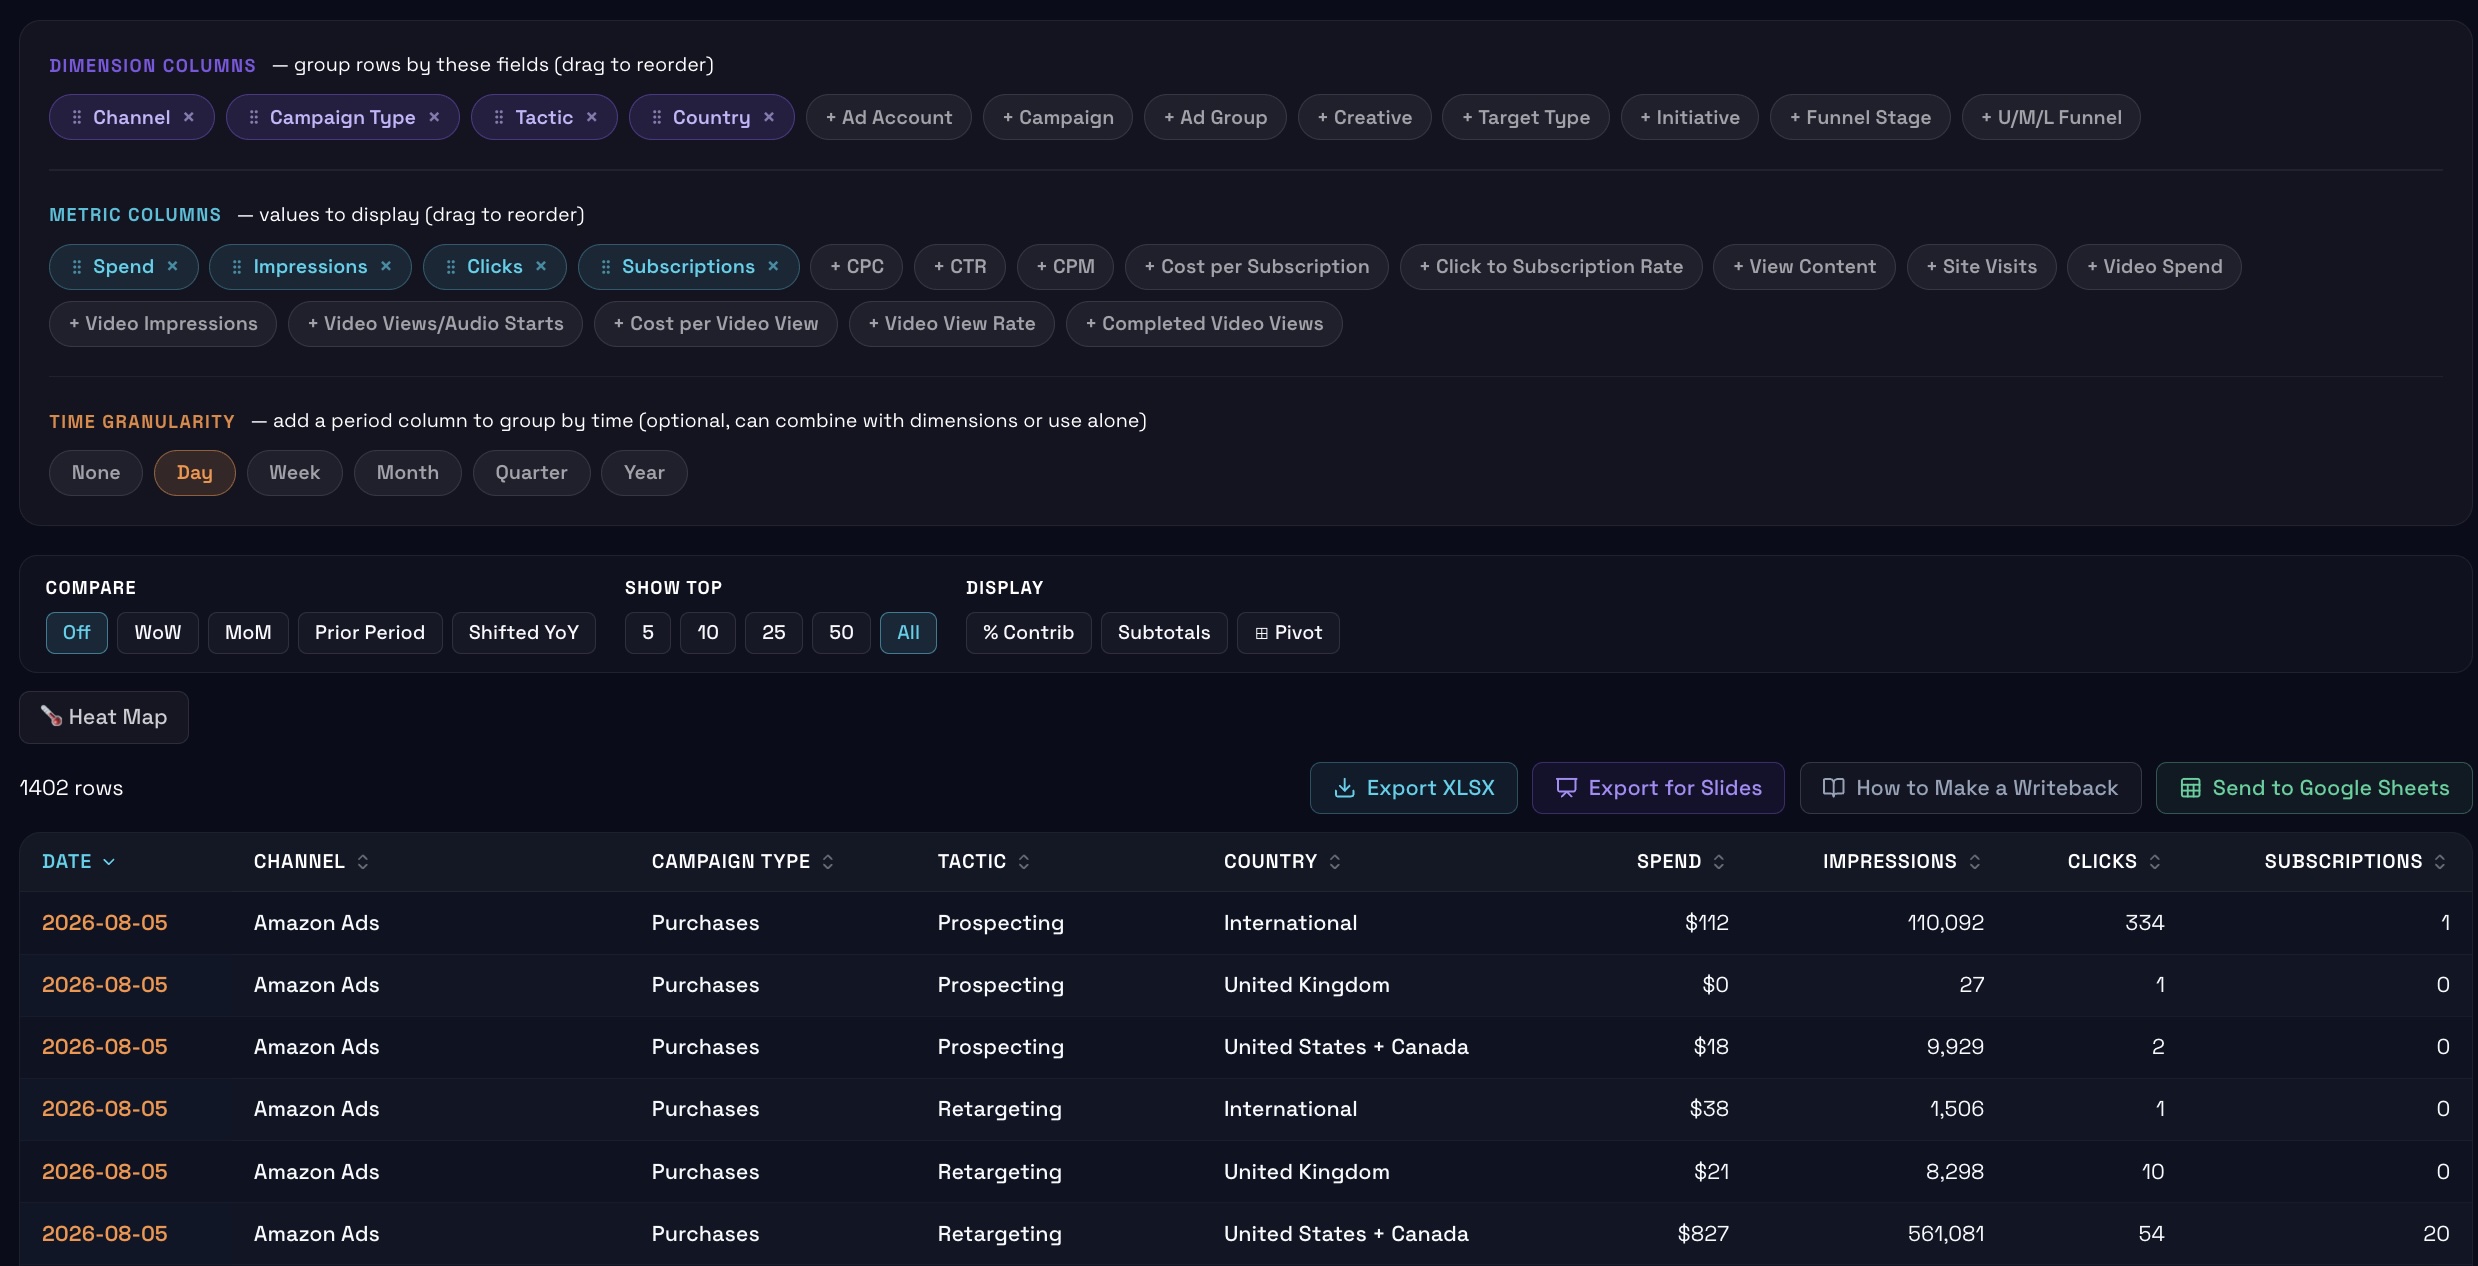
See Helix in Action (1 of 6)
Appendix
See Helix in Action (2 of 6)
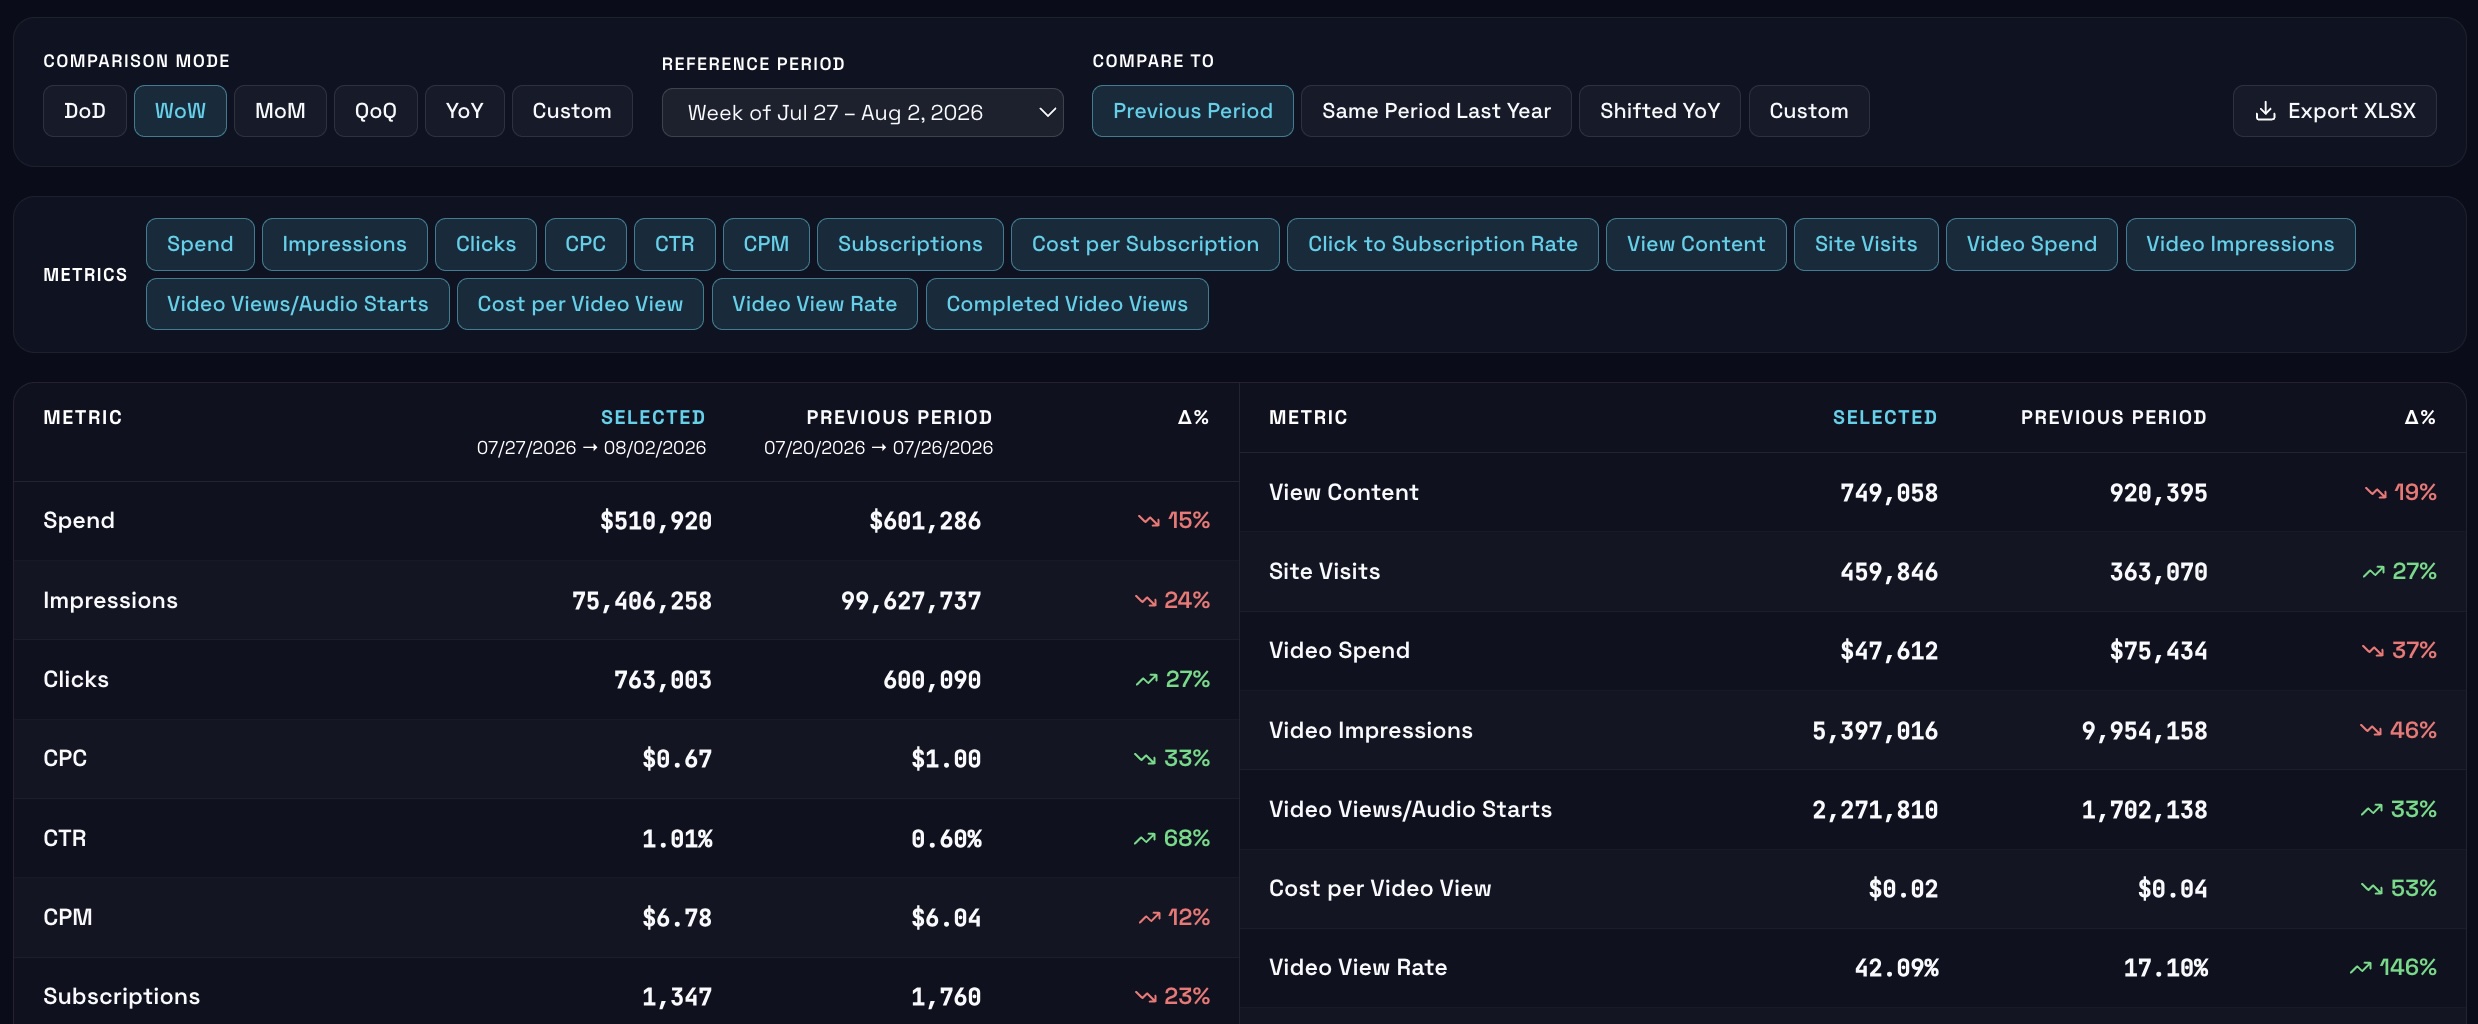
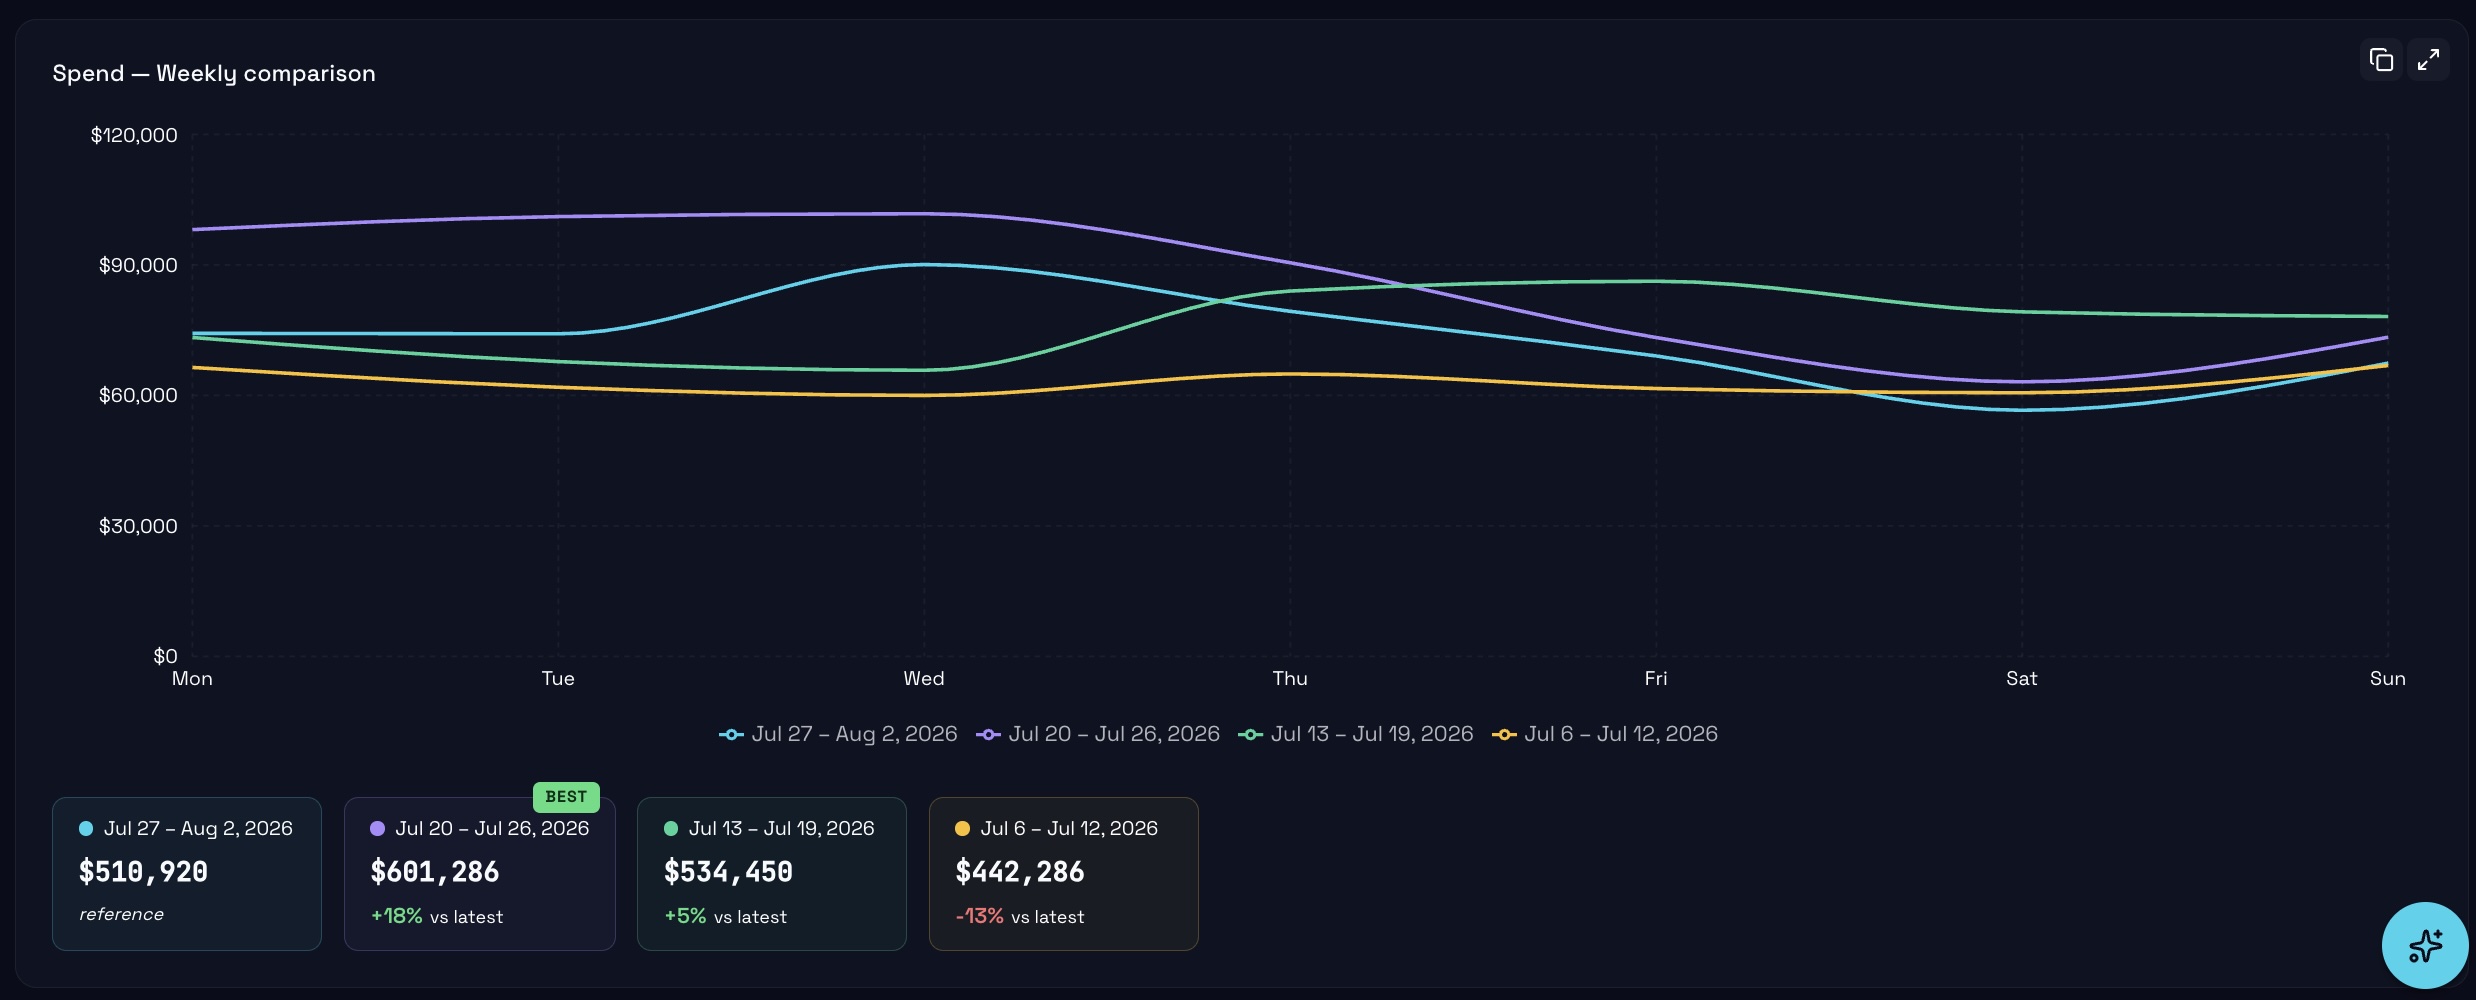
Appendix
See Helix in Action (3 of 6)
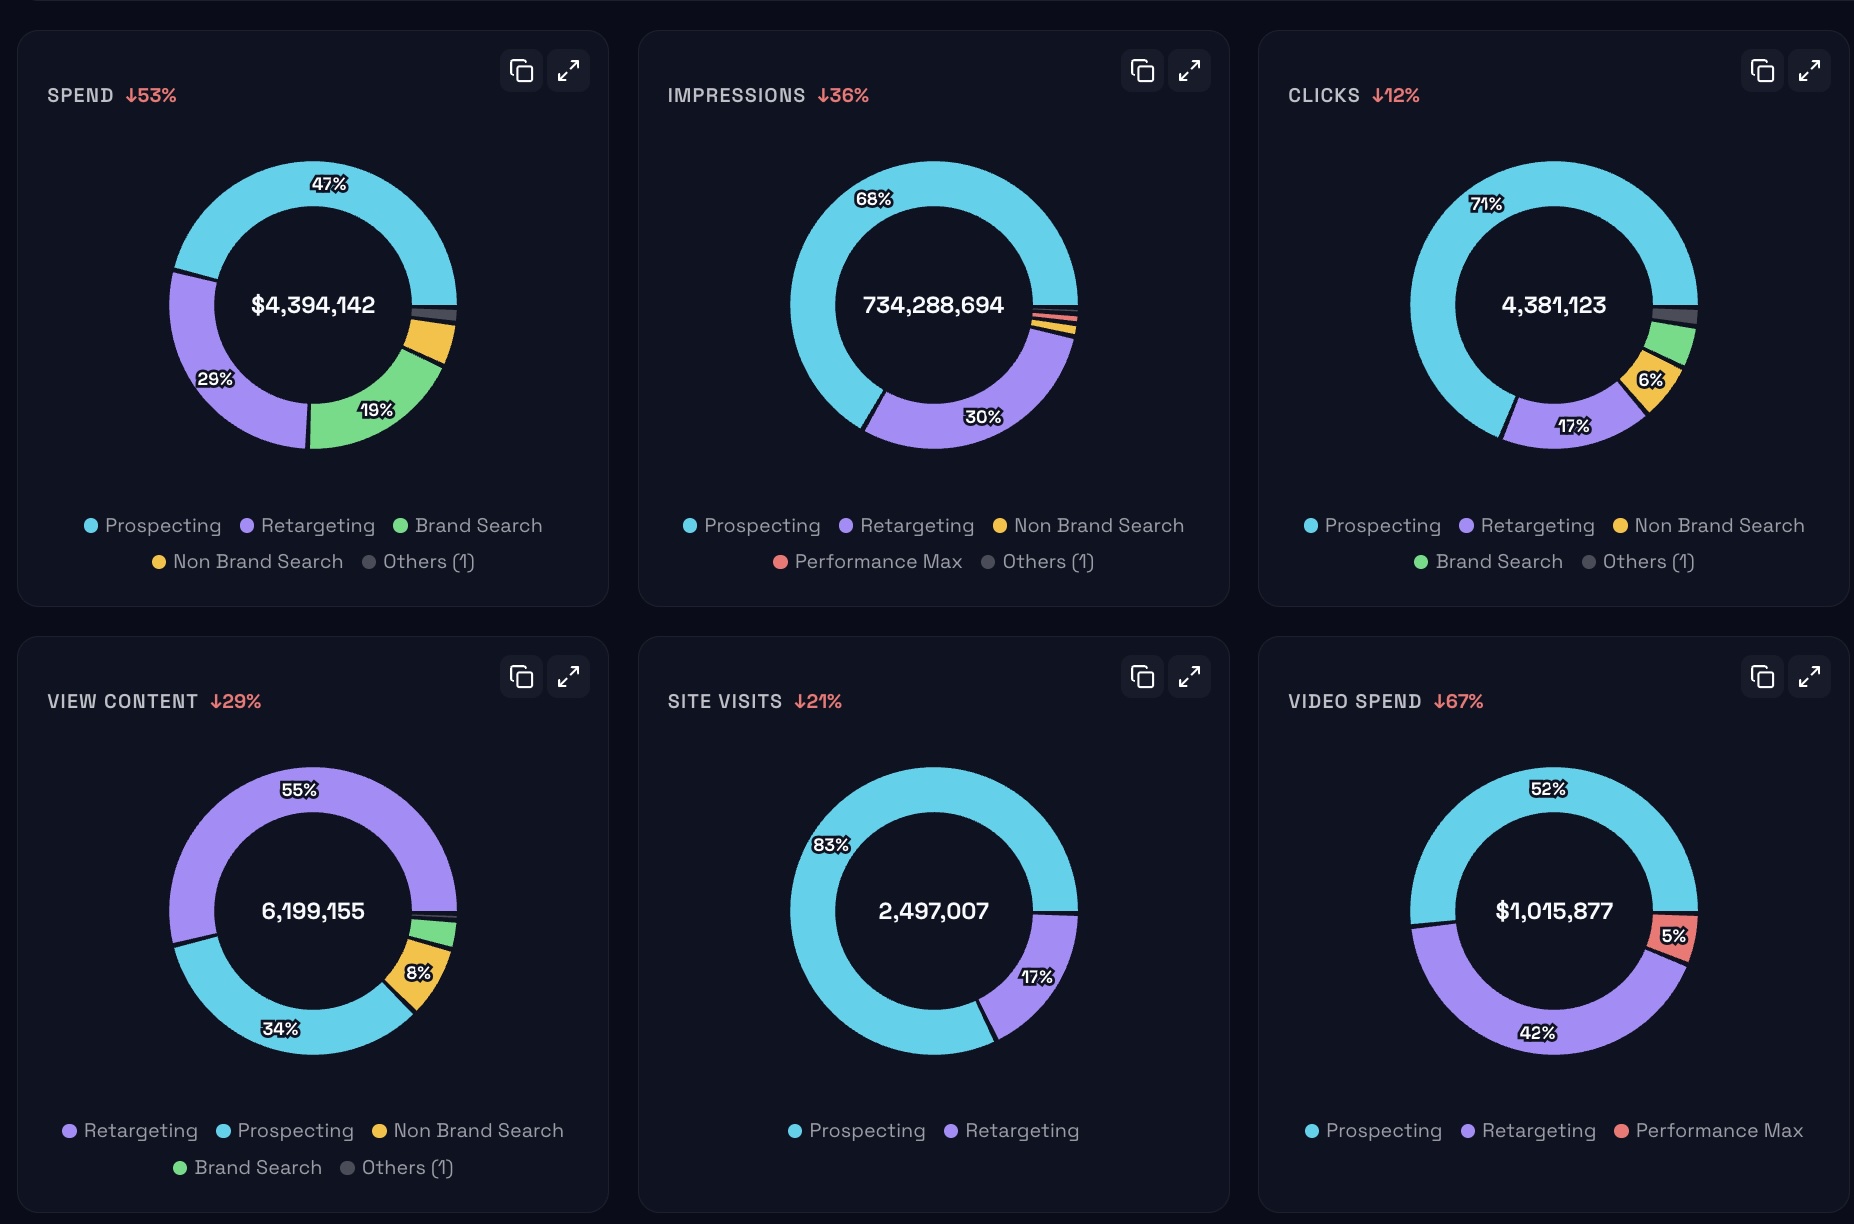
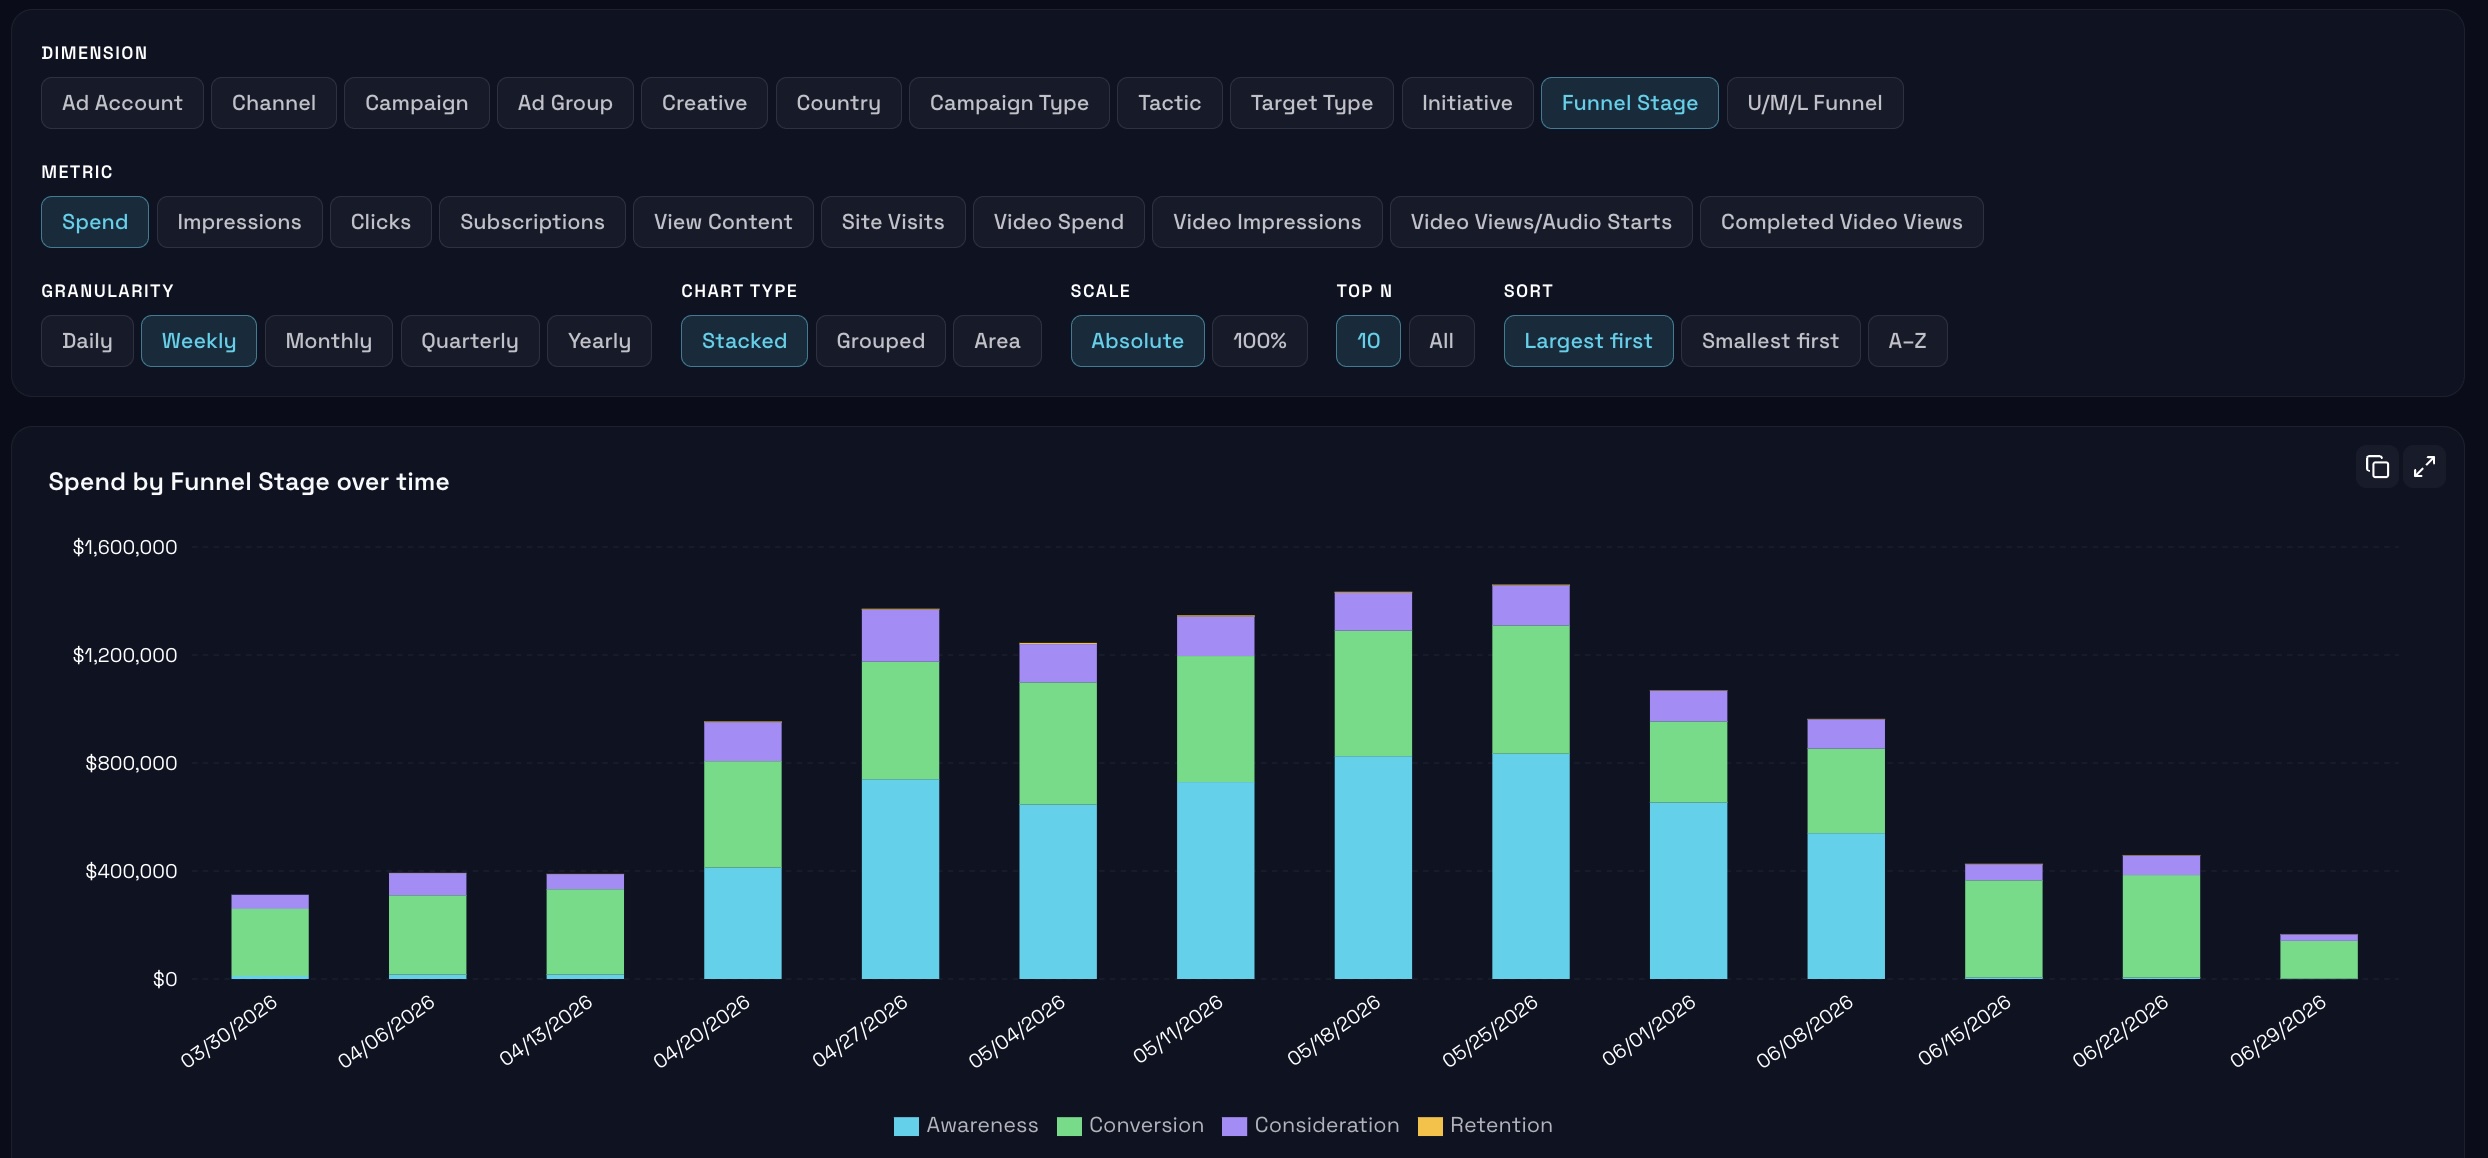
Appendix
See Helix in Action (4 of 6)
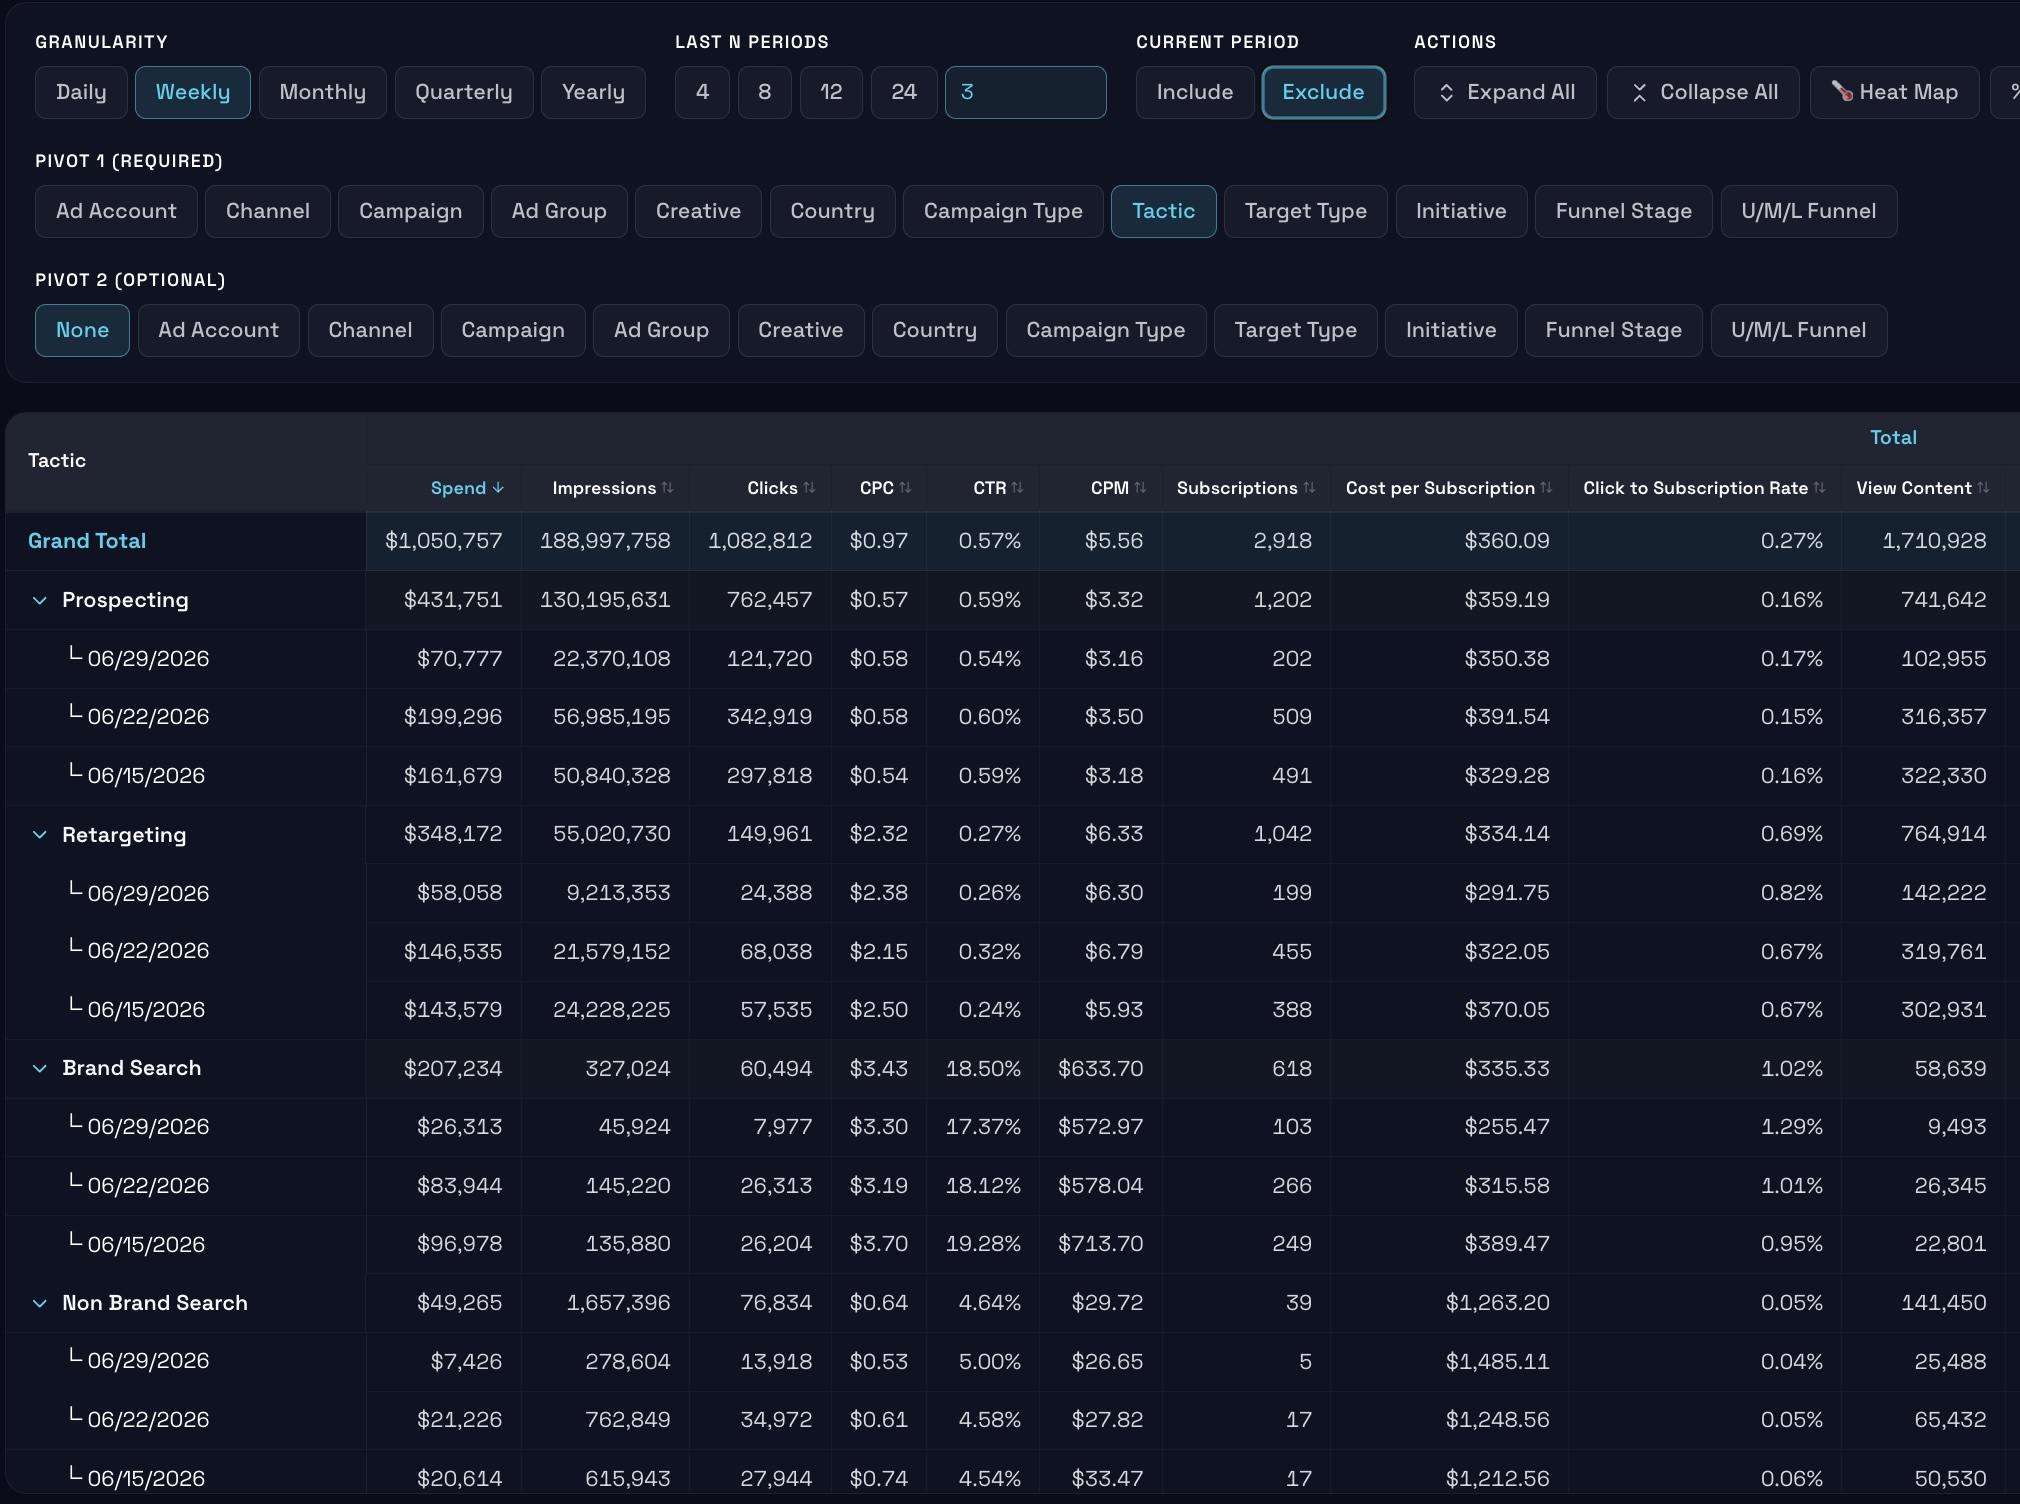
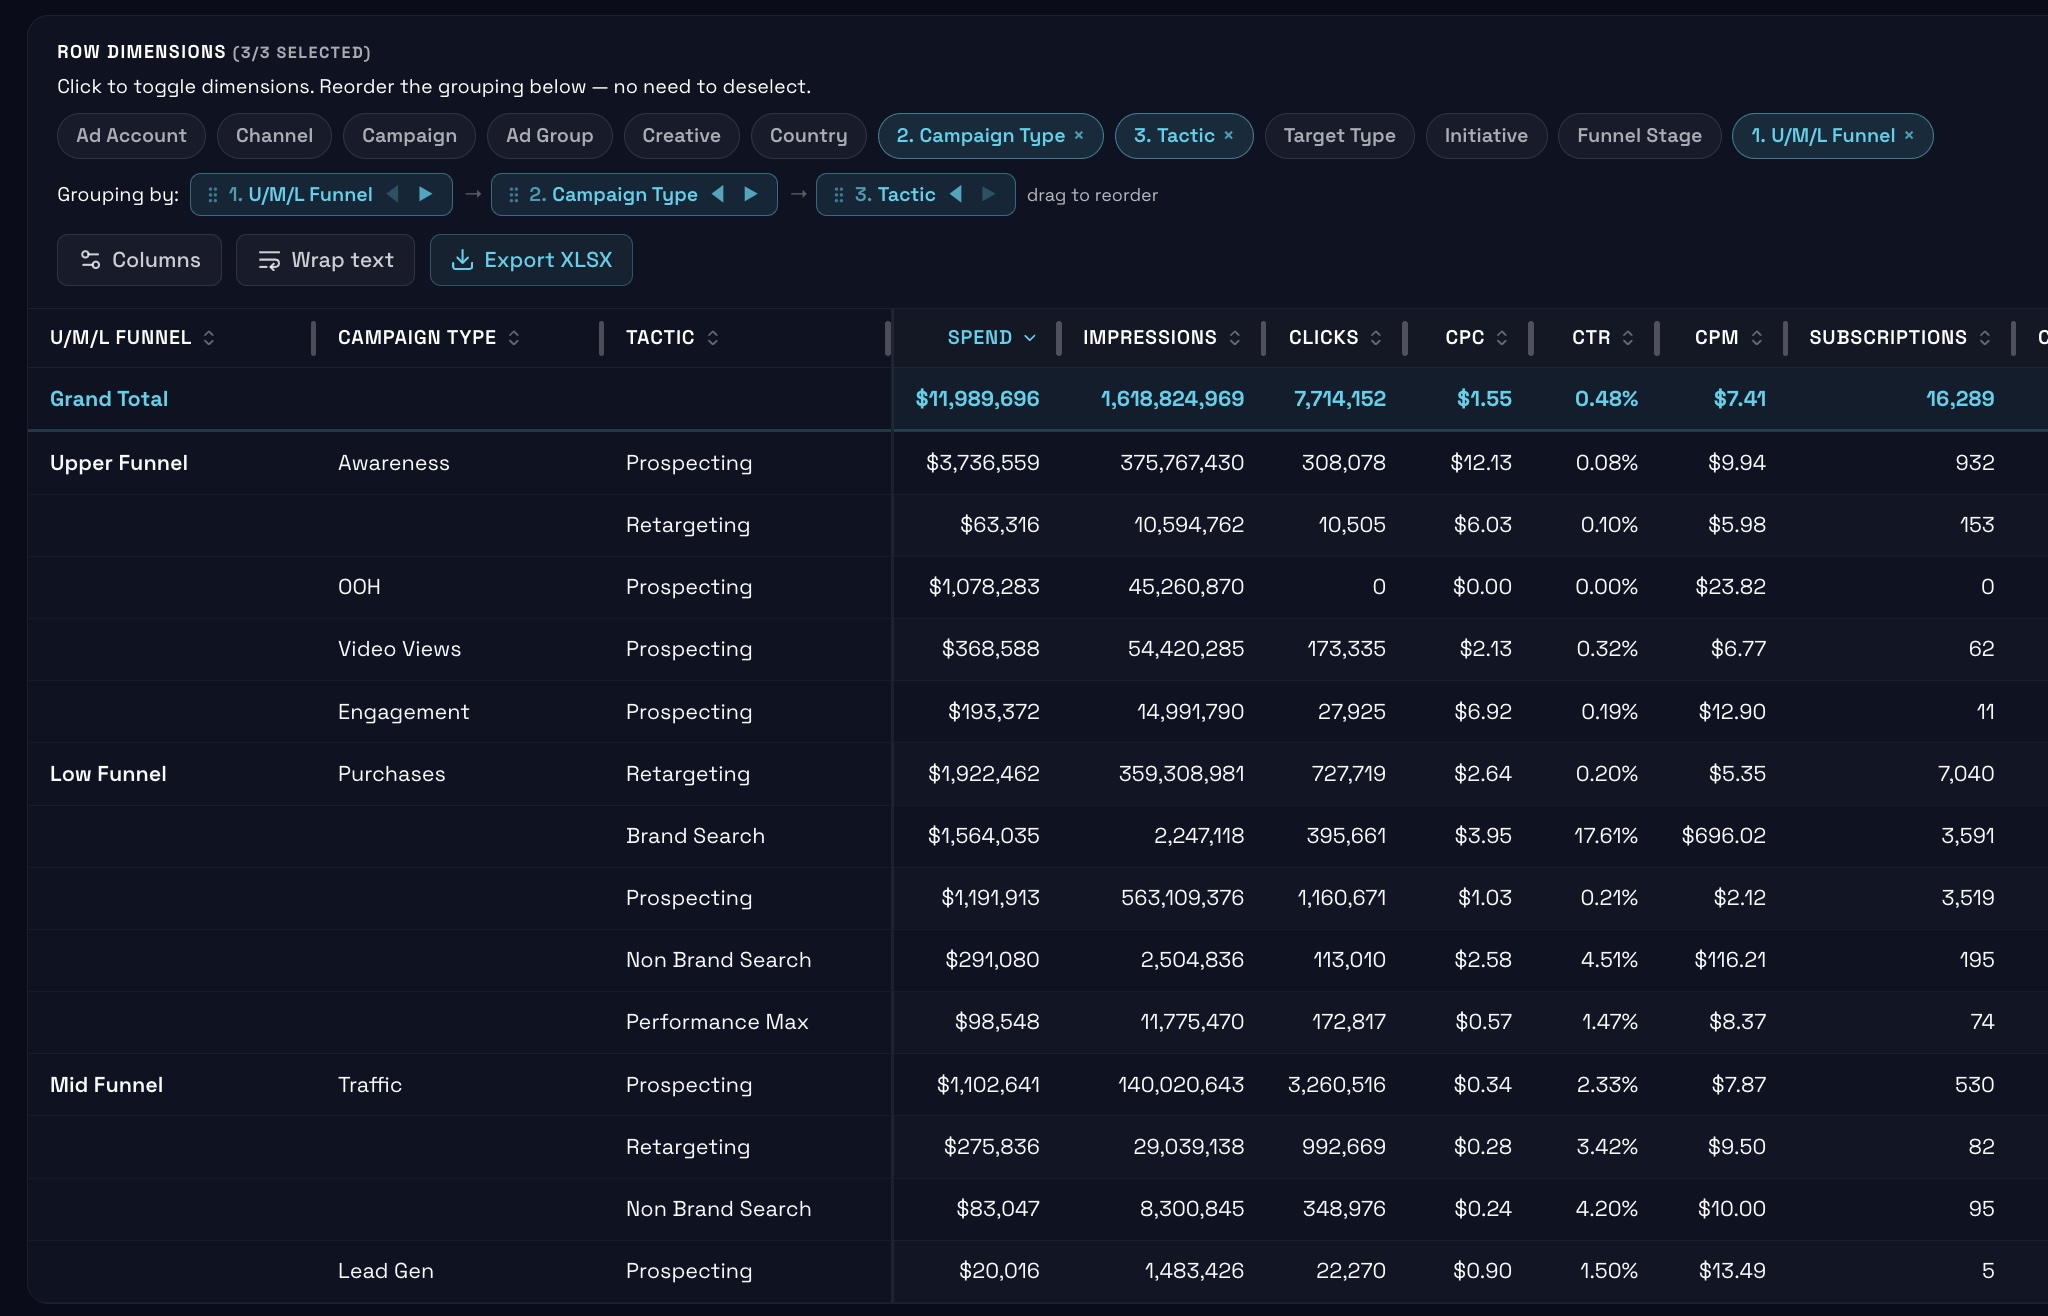
Appendix
See Helix in Action (5 of 6)
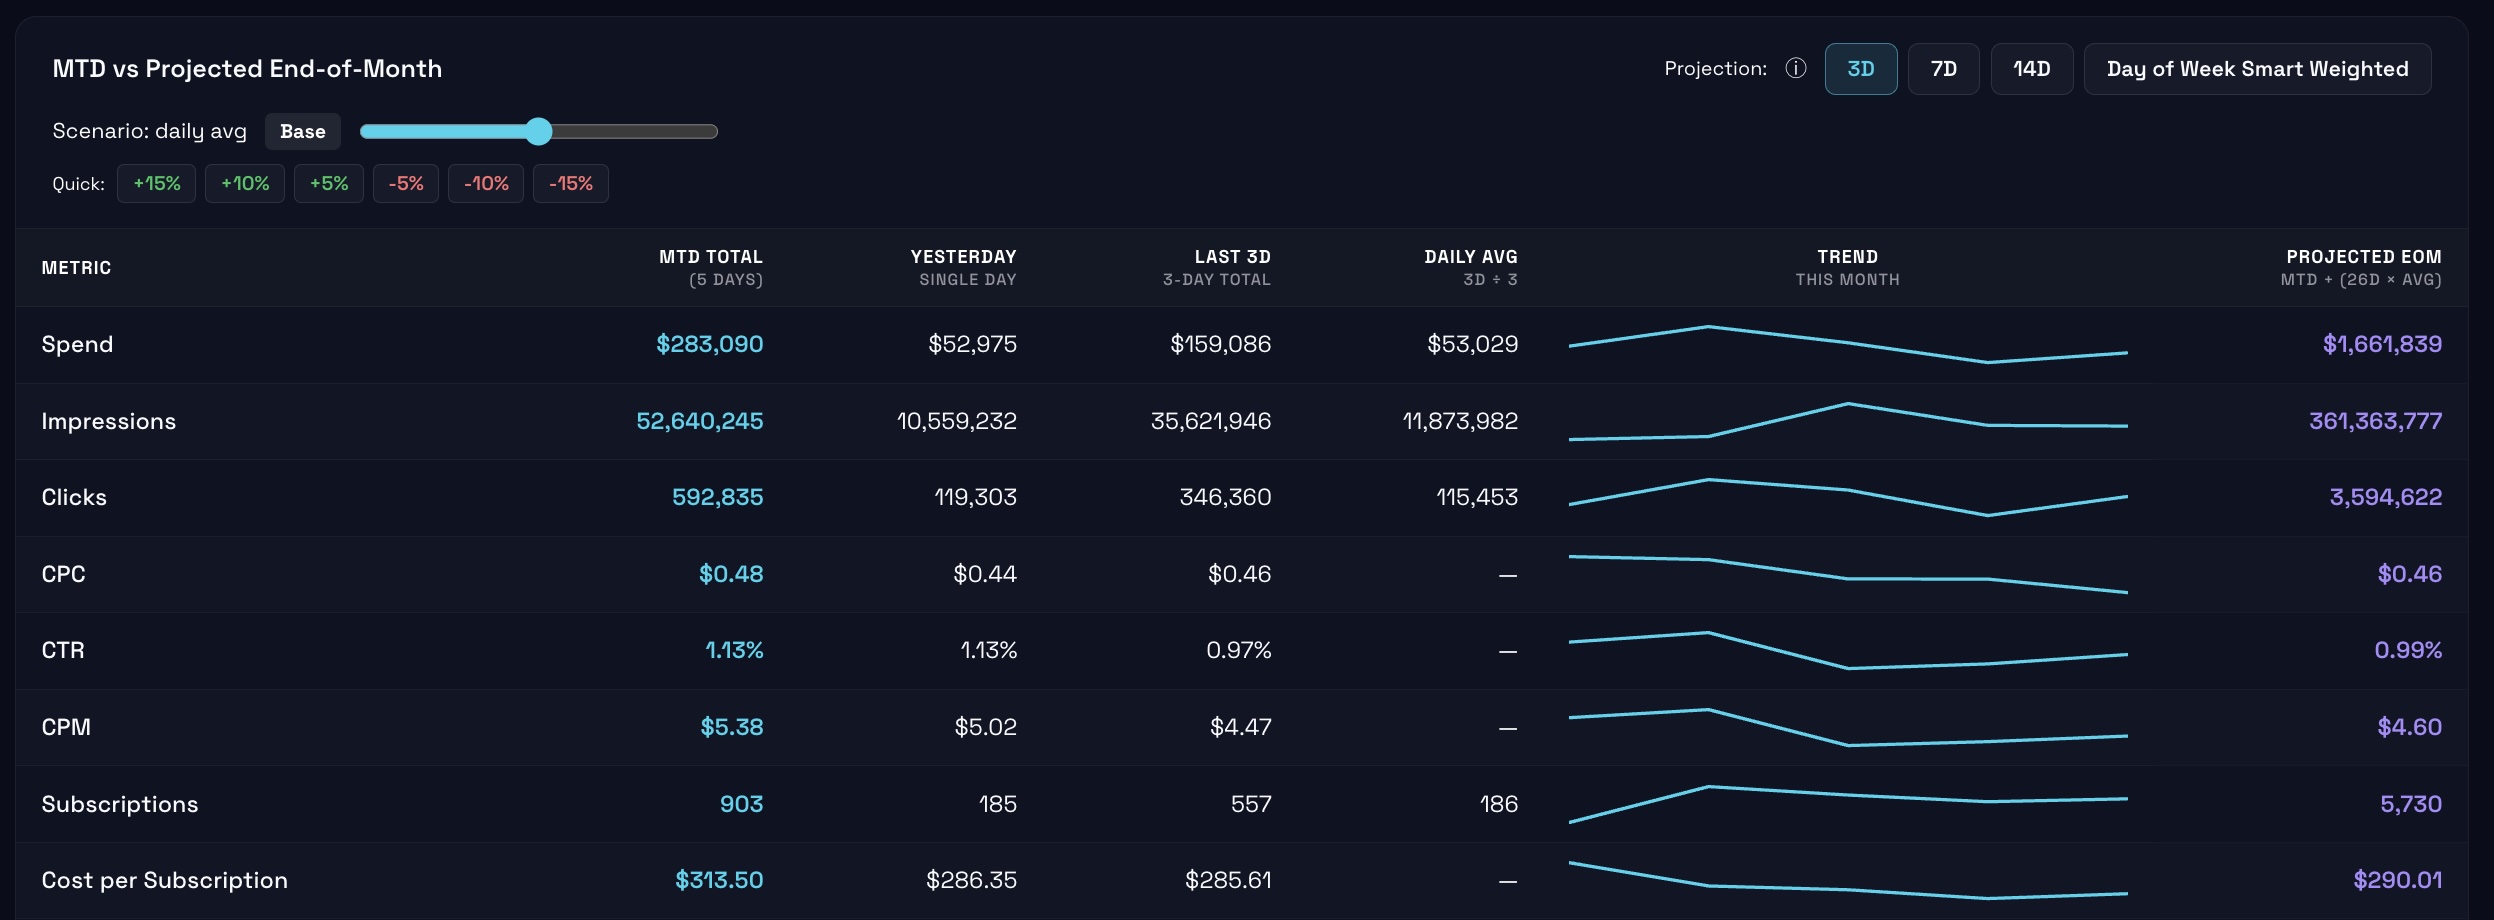
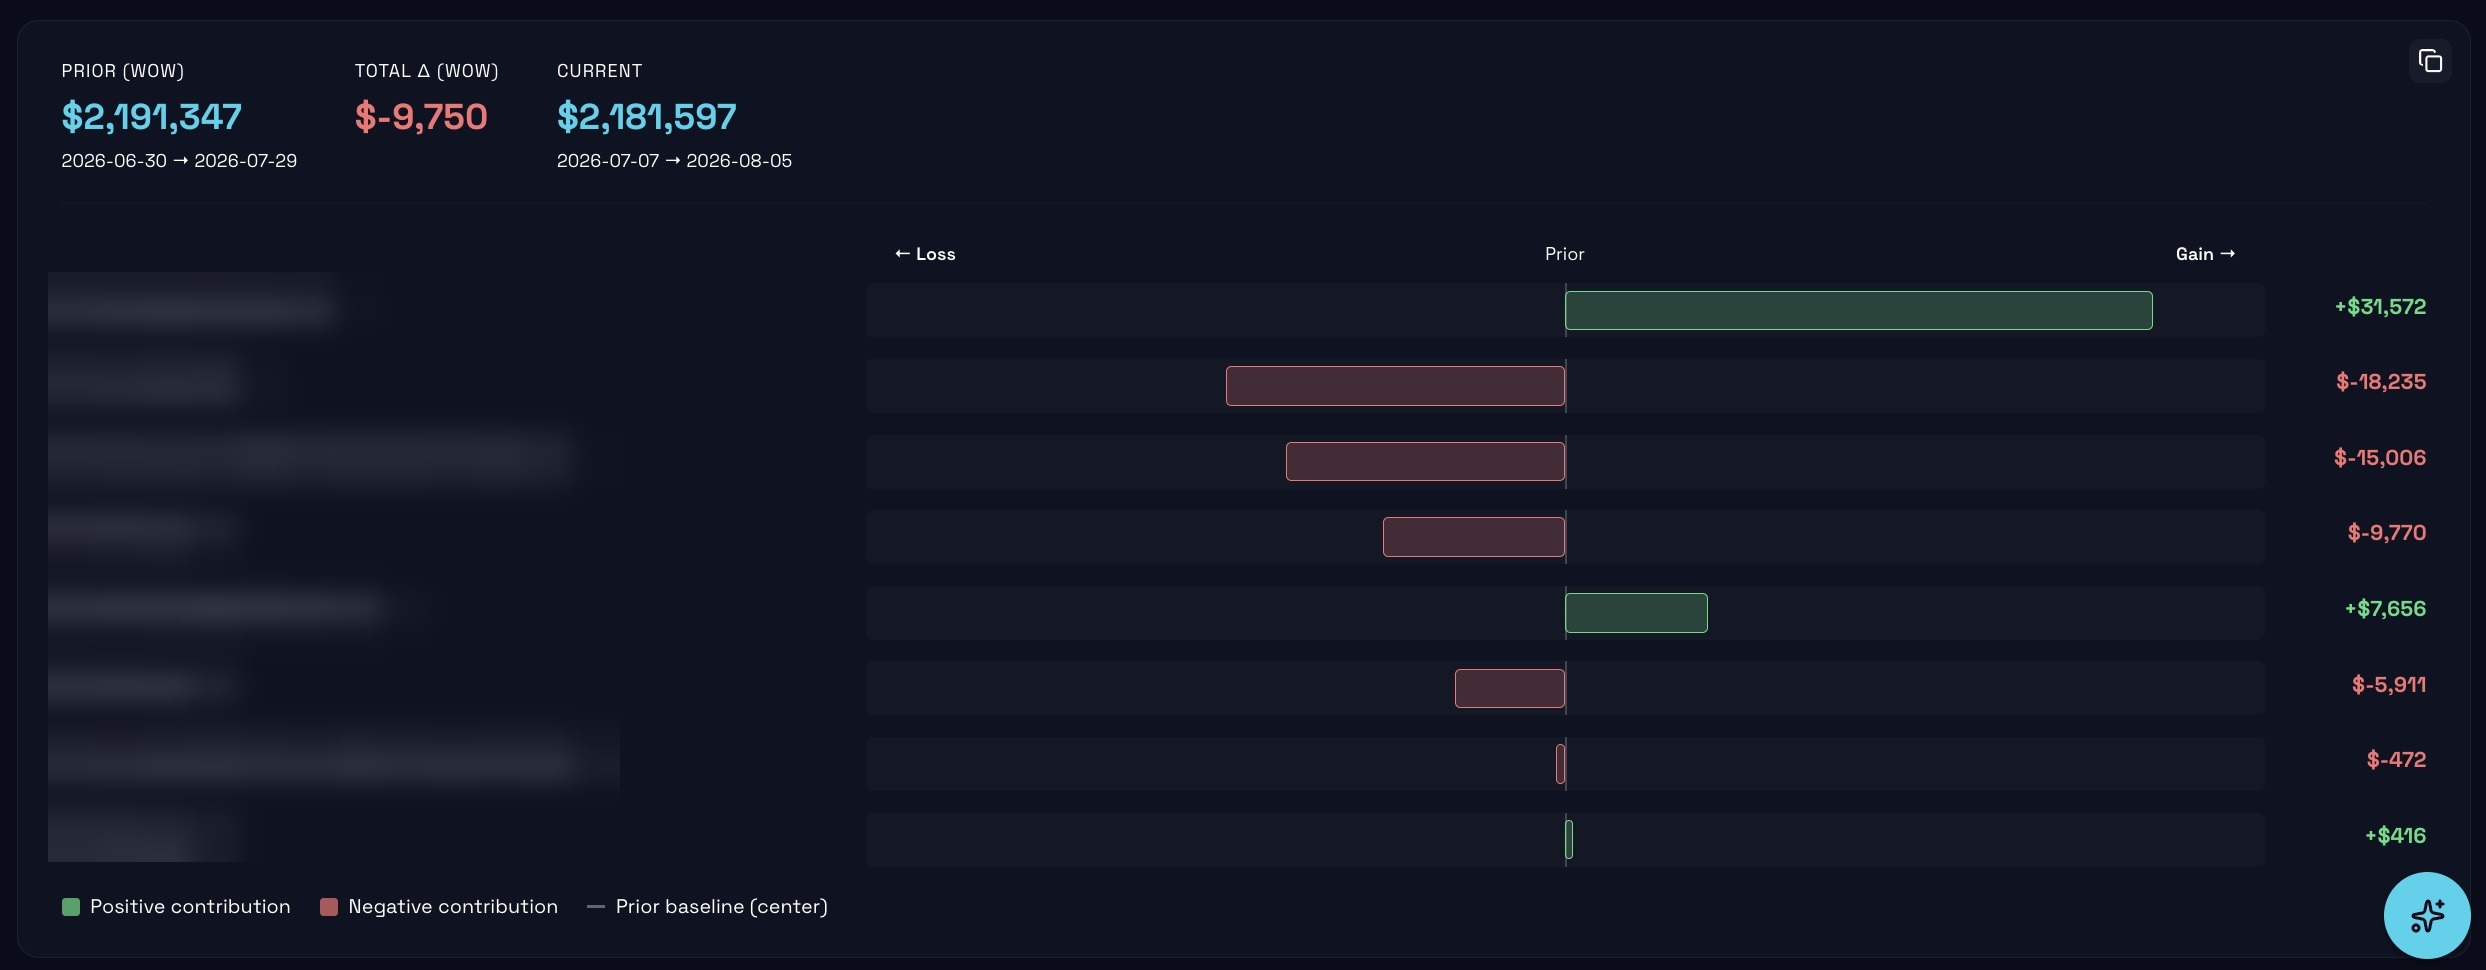
Appendix
See Helix in Action (6 of 6)
The Outcome
What happens when
clarity emerges naturally.
clarity emerges naturally.
01
Clear data.
02
Confident decisions.
03
Faster optimization.
04
Better financial outcomes.
05
Higher team morale.
06
Increased client satisfaction.
Structured complexity leads to clear decisions. Helix is the system behind better decisions — built with you, for you.